Navigation auf uzh.ch
Navigation auf uzh.ch
On the basis of these 15 political, economic and social indicators for the effects of colonialism, we can construct indices for the political, economic and social impact as well as the combined “total” impact of colonialism. This enables us to compare the levels of colonial transformation of the countries of Africa/Asia in a quantitative manner.
The three indices correlate significantly:
This means that, in general, political domination led to economic and social transformation. However, the correlations are not that strong, which indicates that the three dimensions should be measured separately.
Colonies in sub-Saharan Africa were more likely to experience a higher level of transformation, politically, economically and socially (correlations with PTI 0.37, ETI 0.38, STI 0.58), than the Asian/North African ones. The smallest difference to be found is regarding political transformation. That means that, although political domination was not much less intensive in Asia/North Africa, these economies and societies were more difficult to transform through colonialism.
There are no highly significant differences between British and French colonies regarding the level of colonial transformation. However, British colonies seem to have been transformed a little less than others, politically and economically.
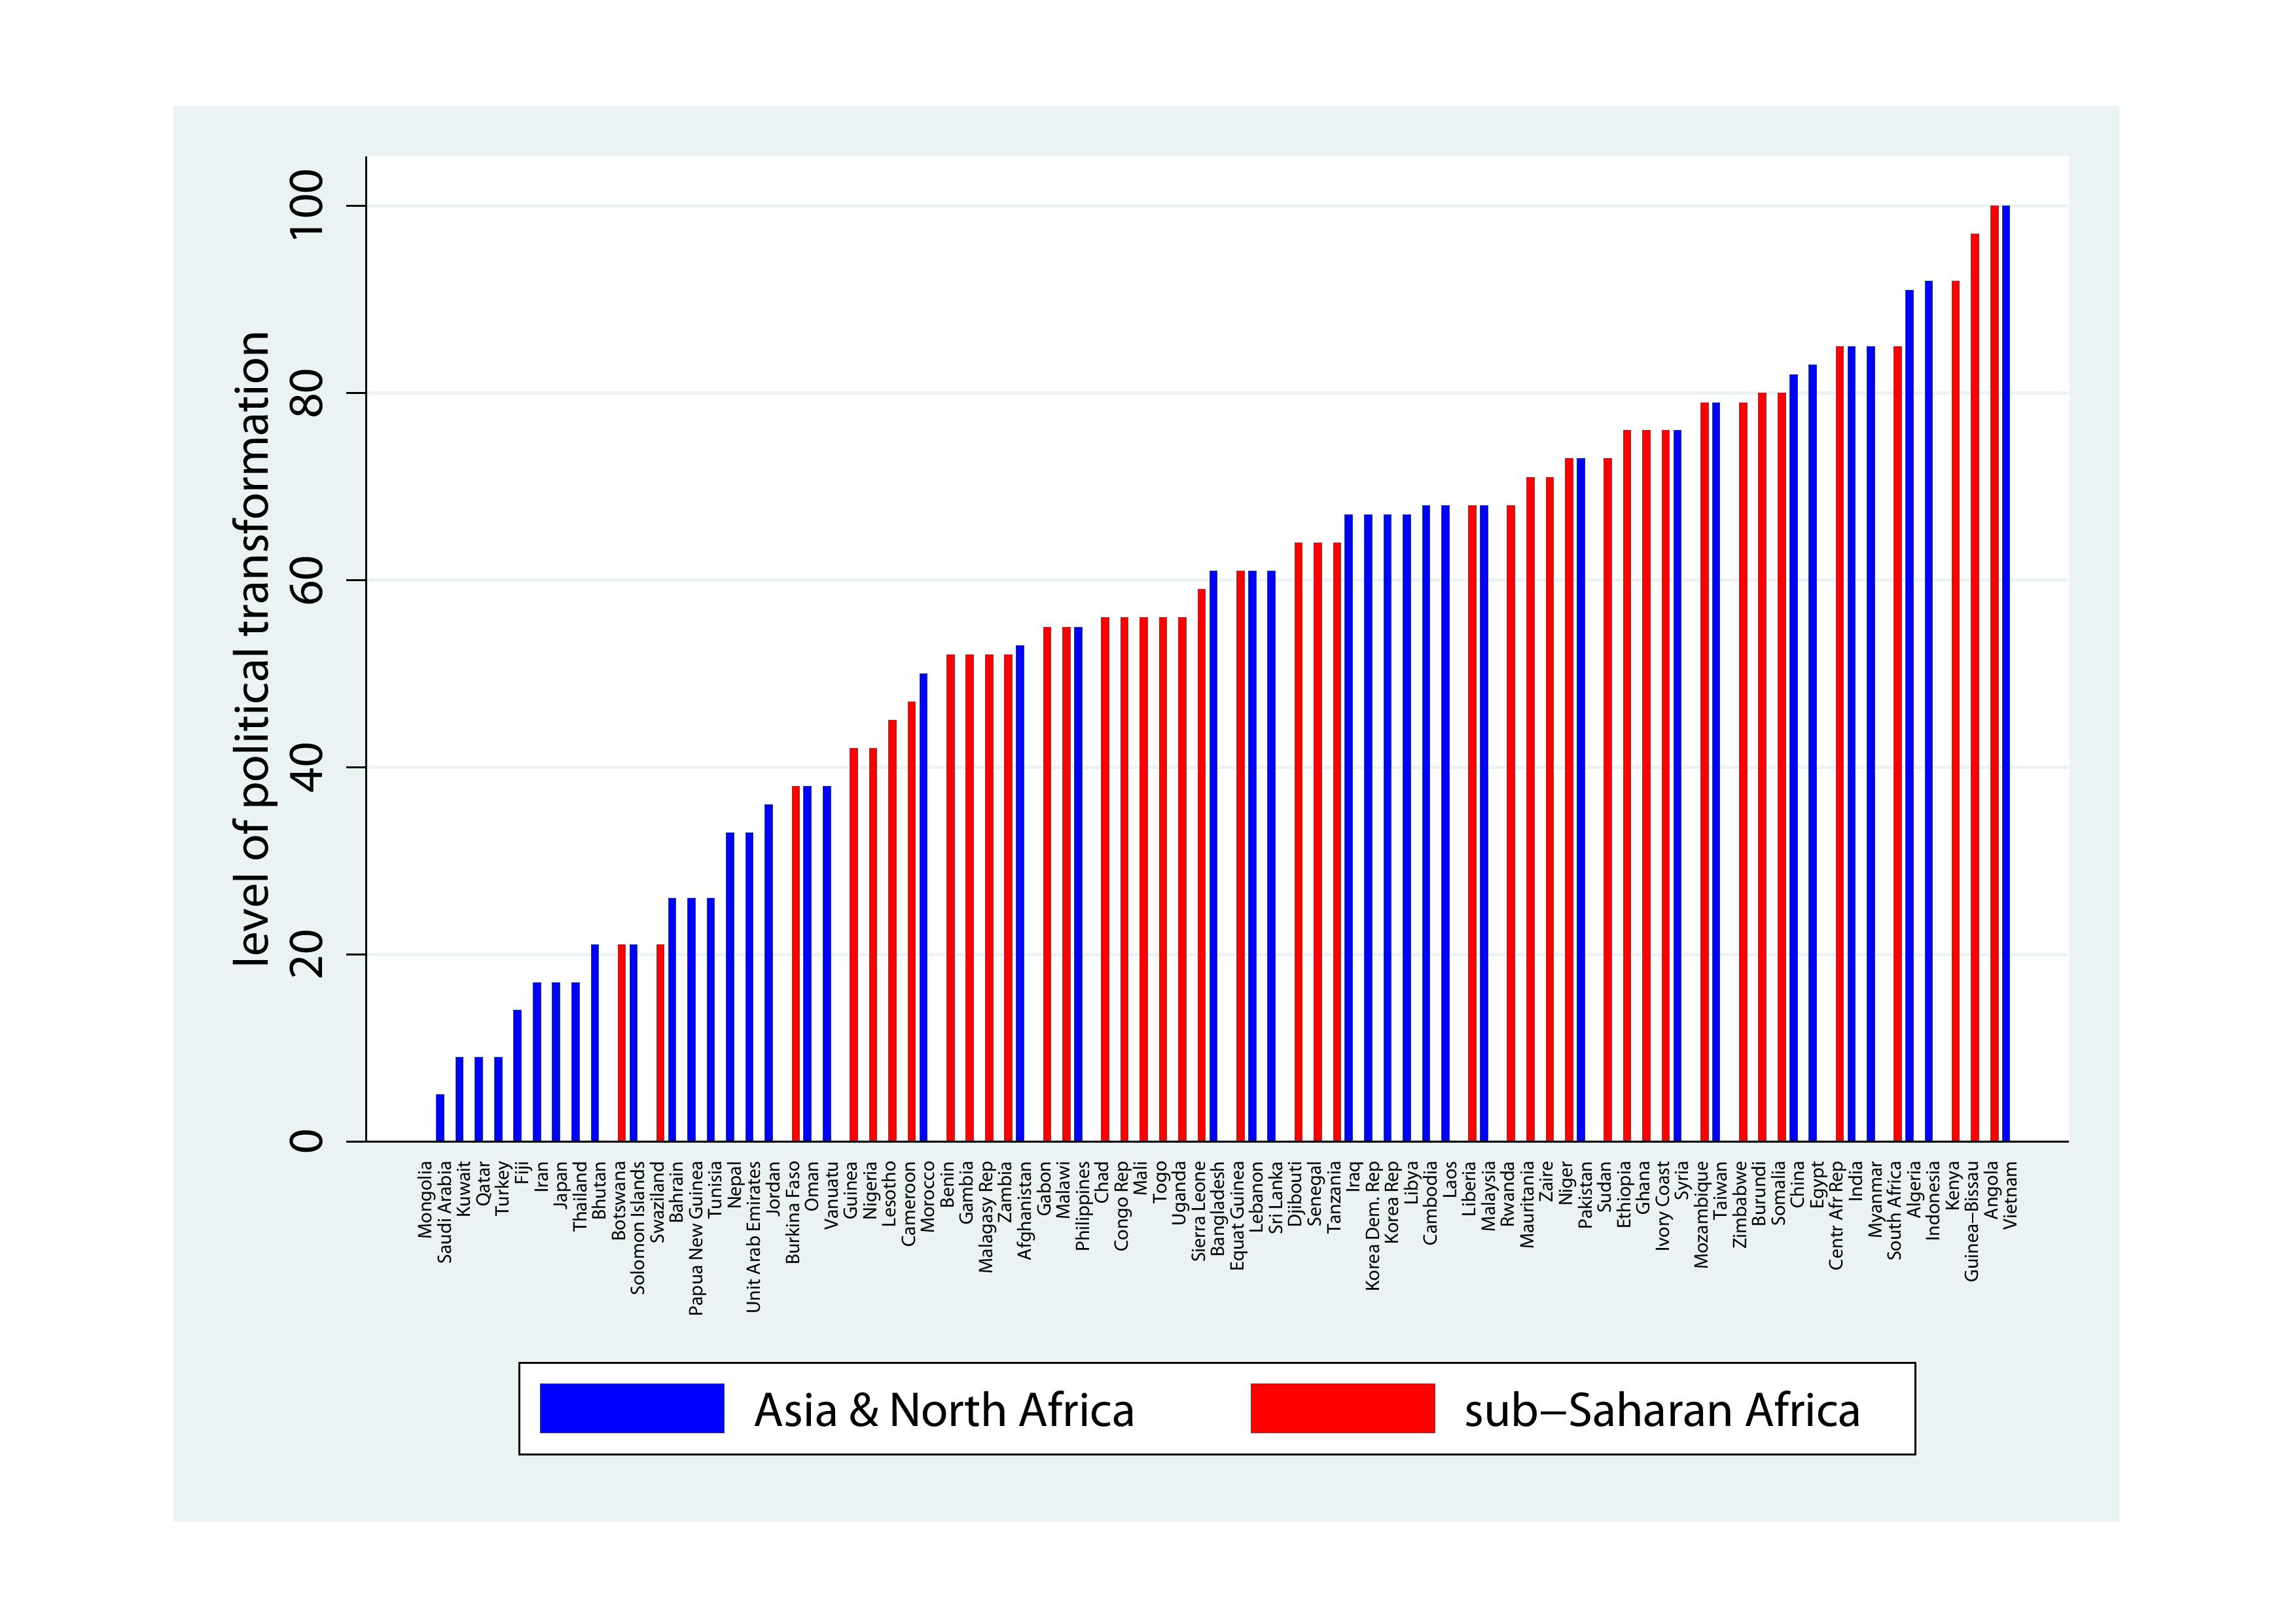
For an index of the political impact of colonialism, we used three indicators: violence (VIOL), form of domination (DOMFORM) and instrumentalization of ethnolinguistic/religious cleavages (ETHN-FUNC).
The graph ranks the countries of Africa/Asia according to their levels of colonially-induced political transformation. As in the following graphs, countries of Asia North Africa are marked in blue, countries of sub-Saharan Africa in red. Although some Asian countries, e.g. Vietnam, Indonesia and especially South Asia (former British-India, Burma, Ceylon) did experience colonial domination with far-reaching consequences, the political impact of colonialism has been widest in sub-Saharan Africa, in areas where a lesser degree or the absence of traditional state- and empire-building opened opportunities for significant political transformations.
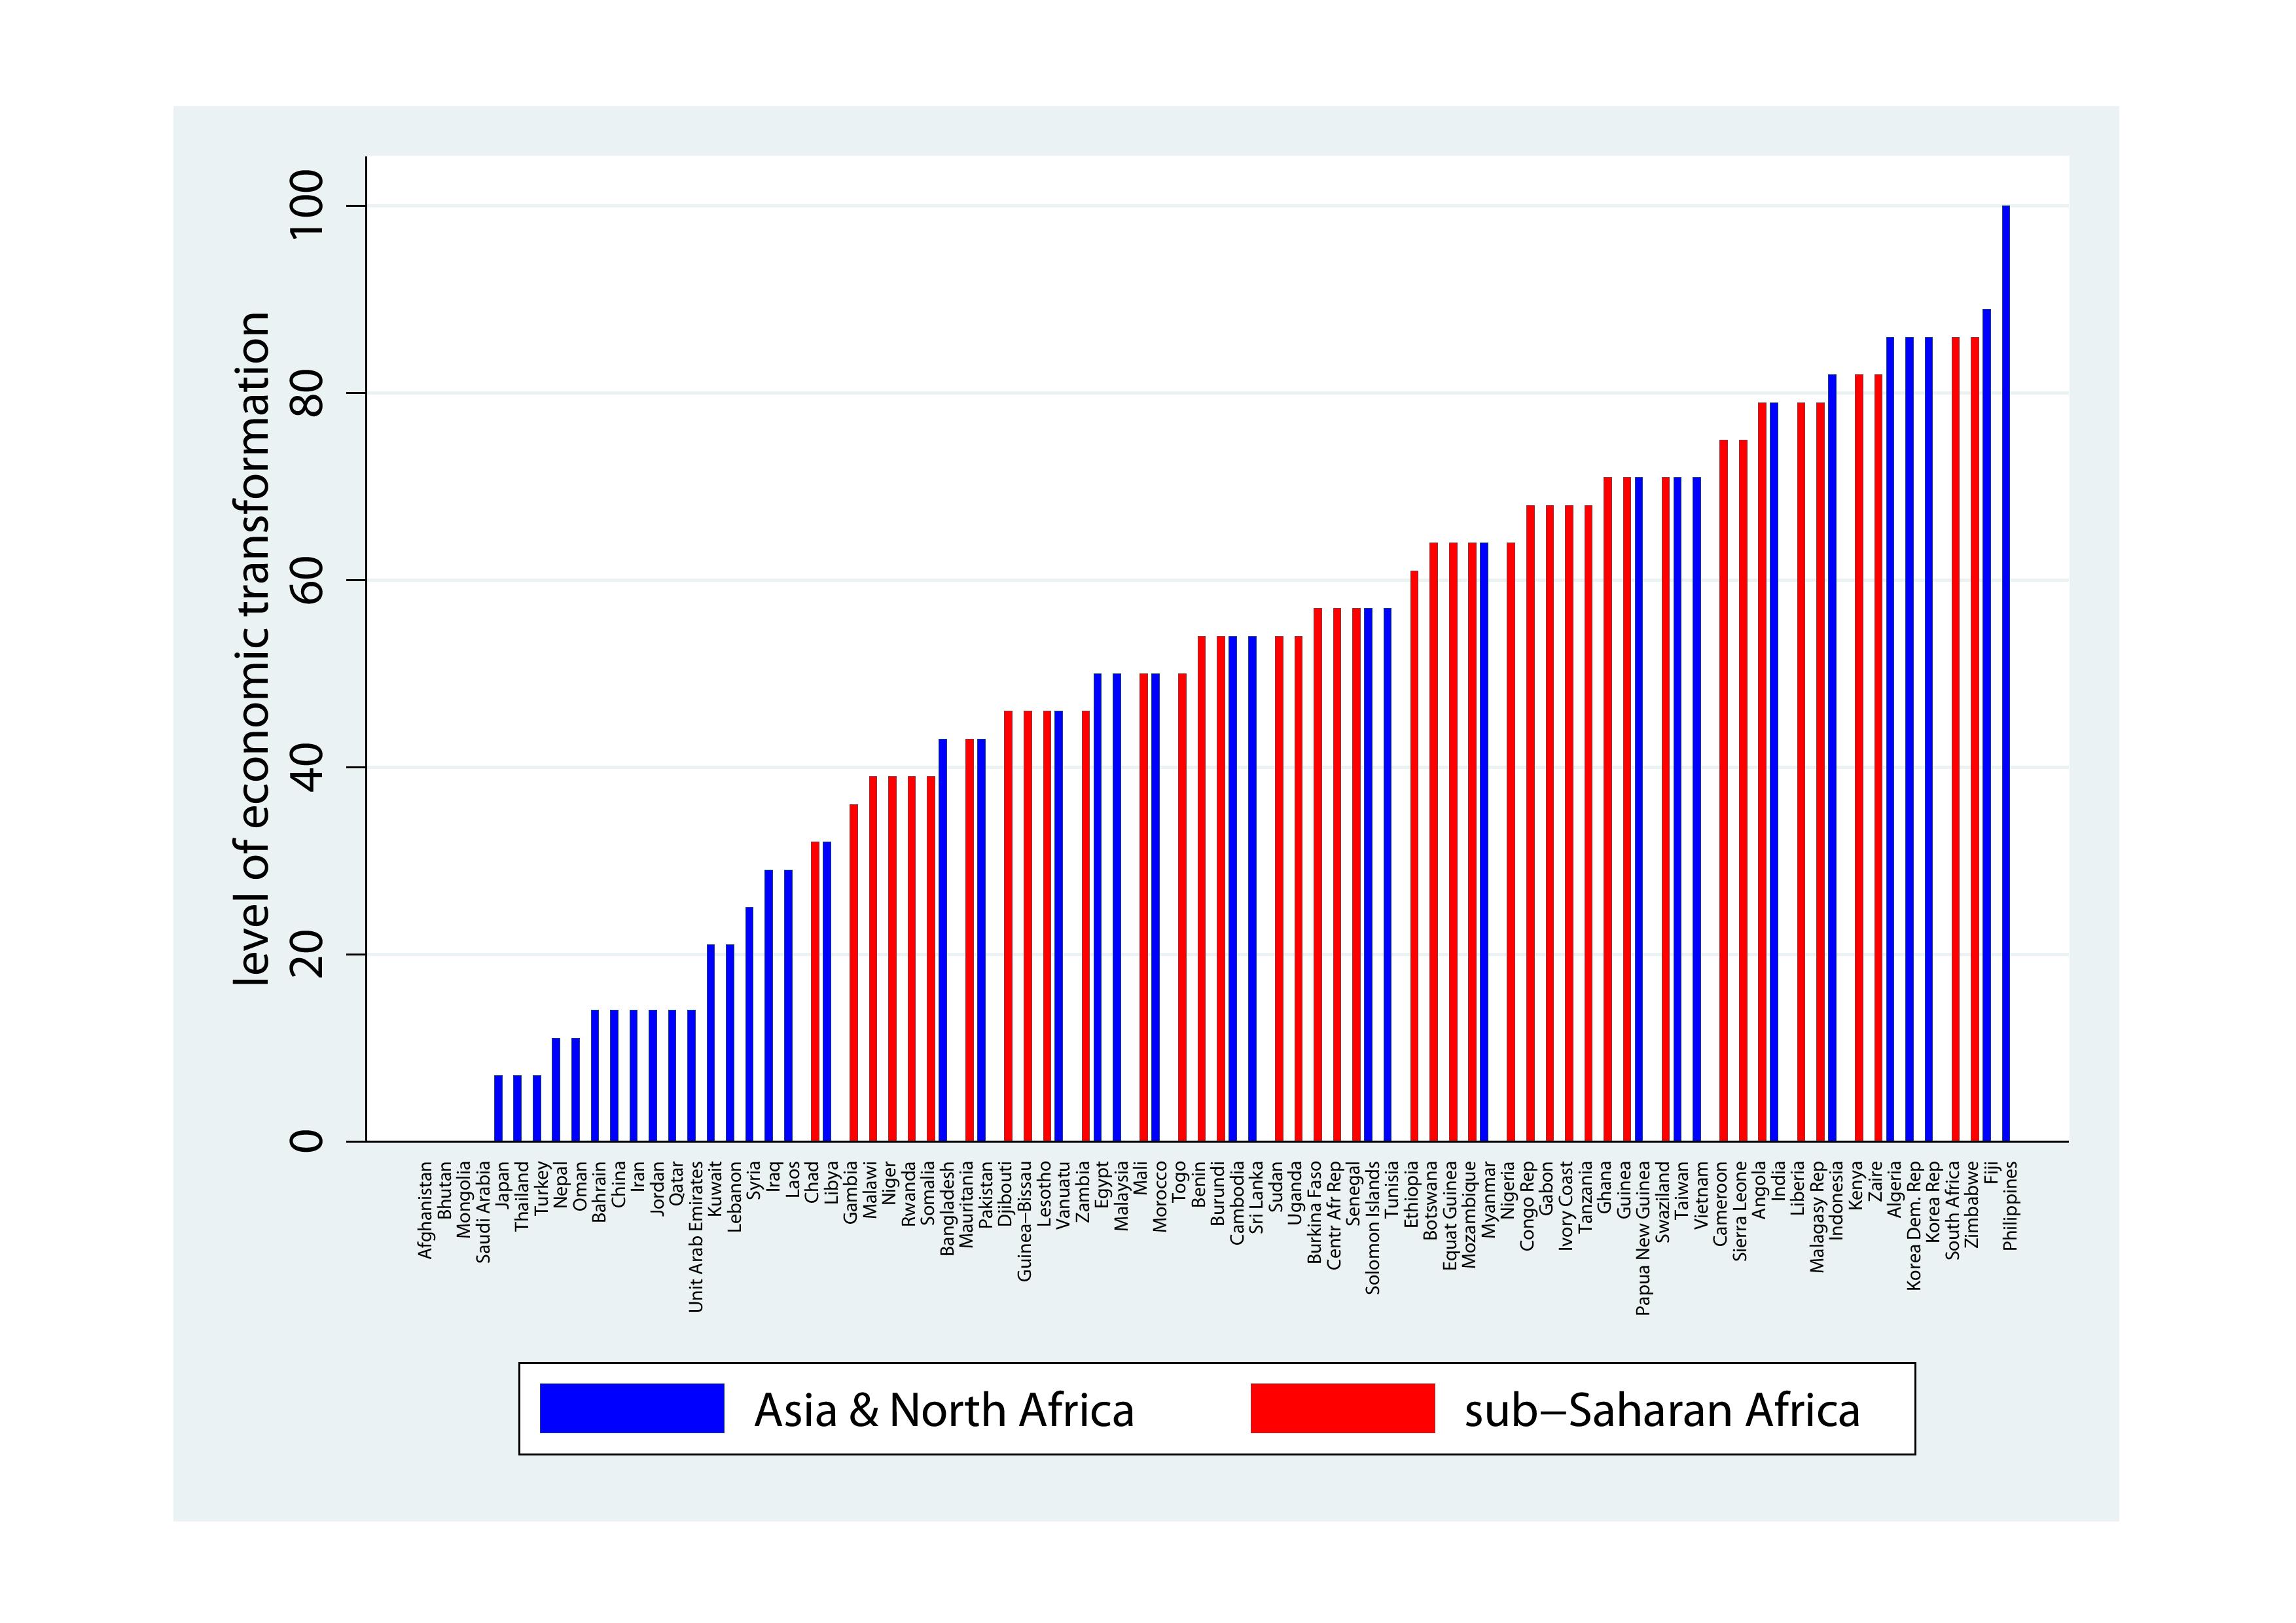
For an index of the economic impact of colonialism, we used seven indicators: trade policy (TRADEPOL), trade concentration (TRADECON), investment concentration (FDICON), investment in infrastructure (INVEST), plantations (PLANTAT), mining (MINING) and gold/silver/diamonds (GOLD).
The graph ranks the countries of Africa/Asia according to their levels of colonially-induced economic transformation. The economic impact of colonialism varied greatly, both in Asia and Africa. Many regions have been transformed through the development of plantations, mining booms and settler economies, others have been tied to empires through colonial policies as in the case of the French mercantilism or Japan’s highly interventionist colonialism. Other areas have remained untouched or only superficially changed through colonialism, such as neglected land-locked regions in Africa as well as highly developed traditional economies in East or West Asia.
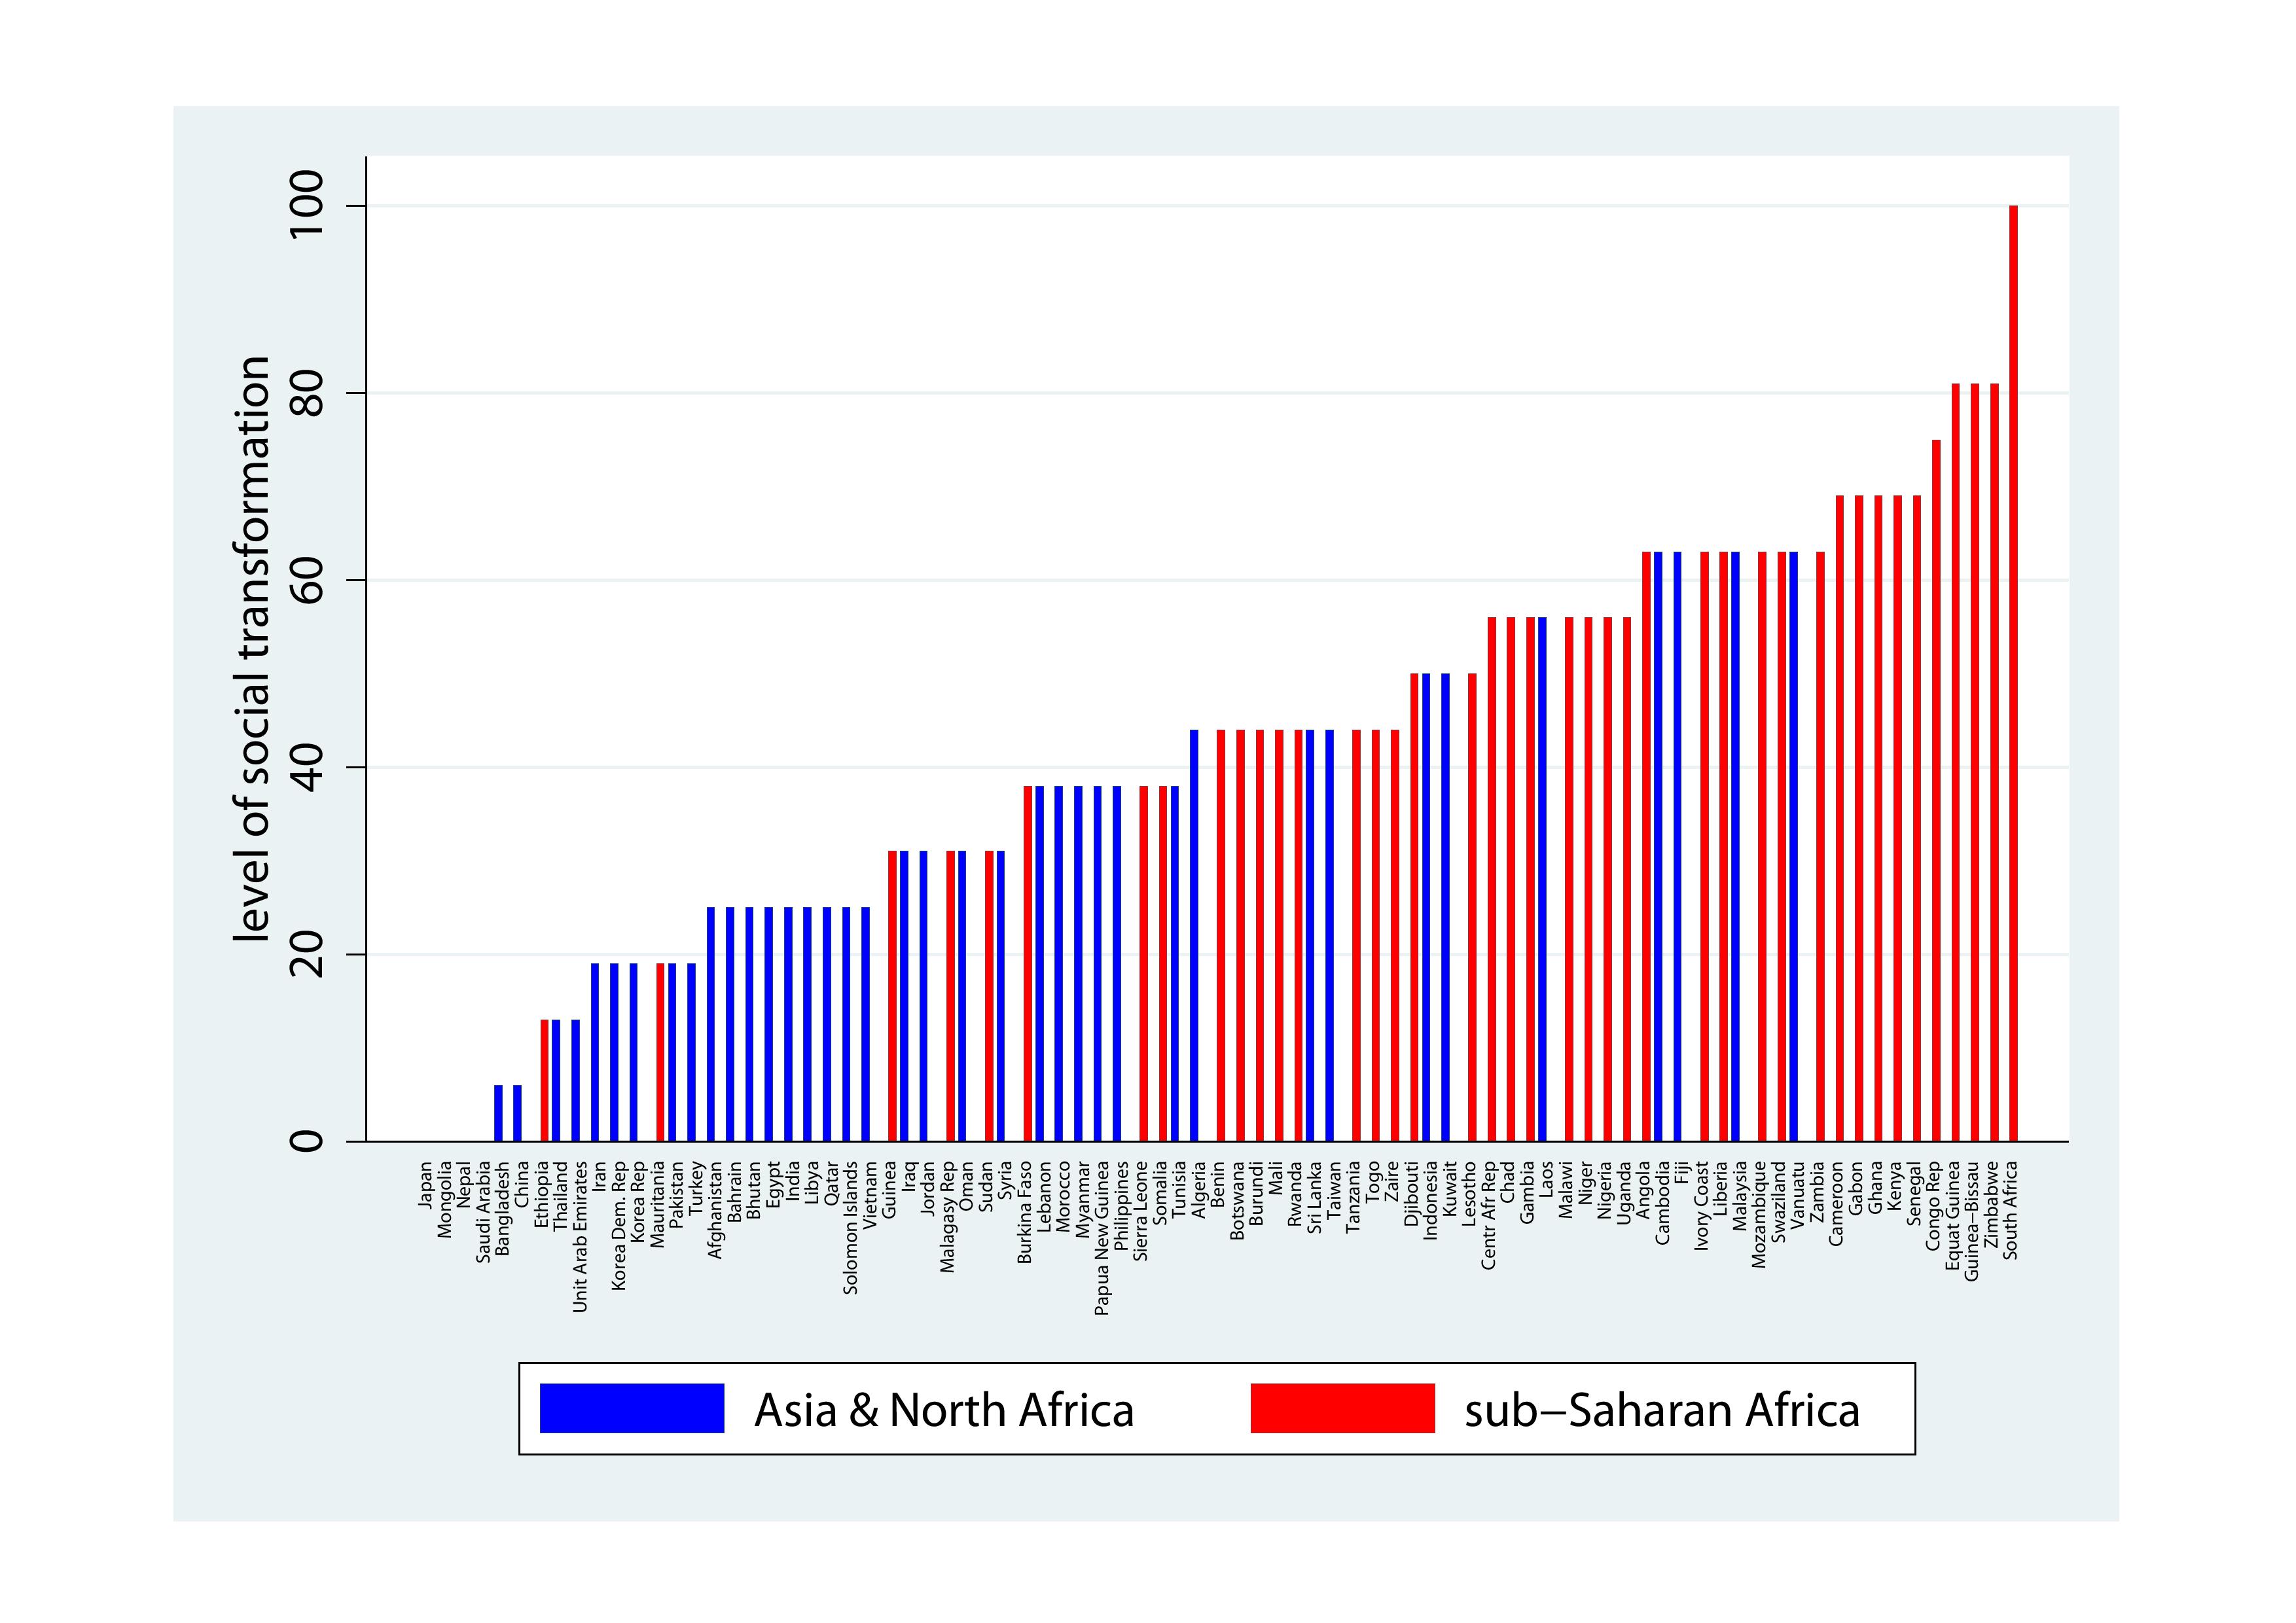
For an index of the social impact of colonialism, we used four indicators: colonial immigration (FORPRE), success of missionary activities (MISSION), work immigration (WORKIM) and partition (BORDERS).
The graph ranks the countries of Africa/Asia according to their levels of colonially-induced political transformation. Here, the difference between Africa and Asia is most pronounced. With few exceptions (French-Indochina, Fiji, Malaysia), all countries which experienced a profound colonially-induced social transformation through immigration, proselytization and partition are located in Africa south of the Sahara. In most heavily-populated areas with traditional states and empires as well as dominant scriptoral religions, this was not possible, not necessary or not desirable for the respective colonial power.
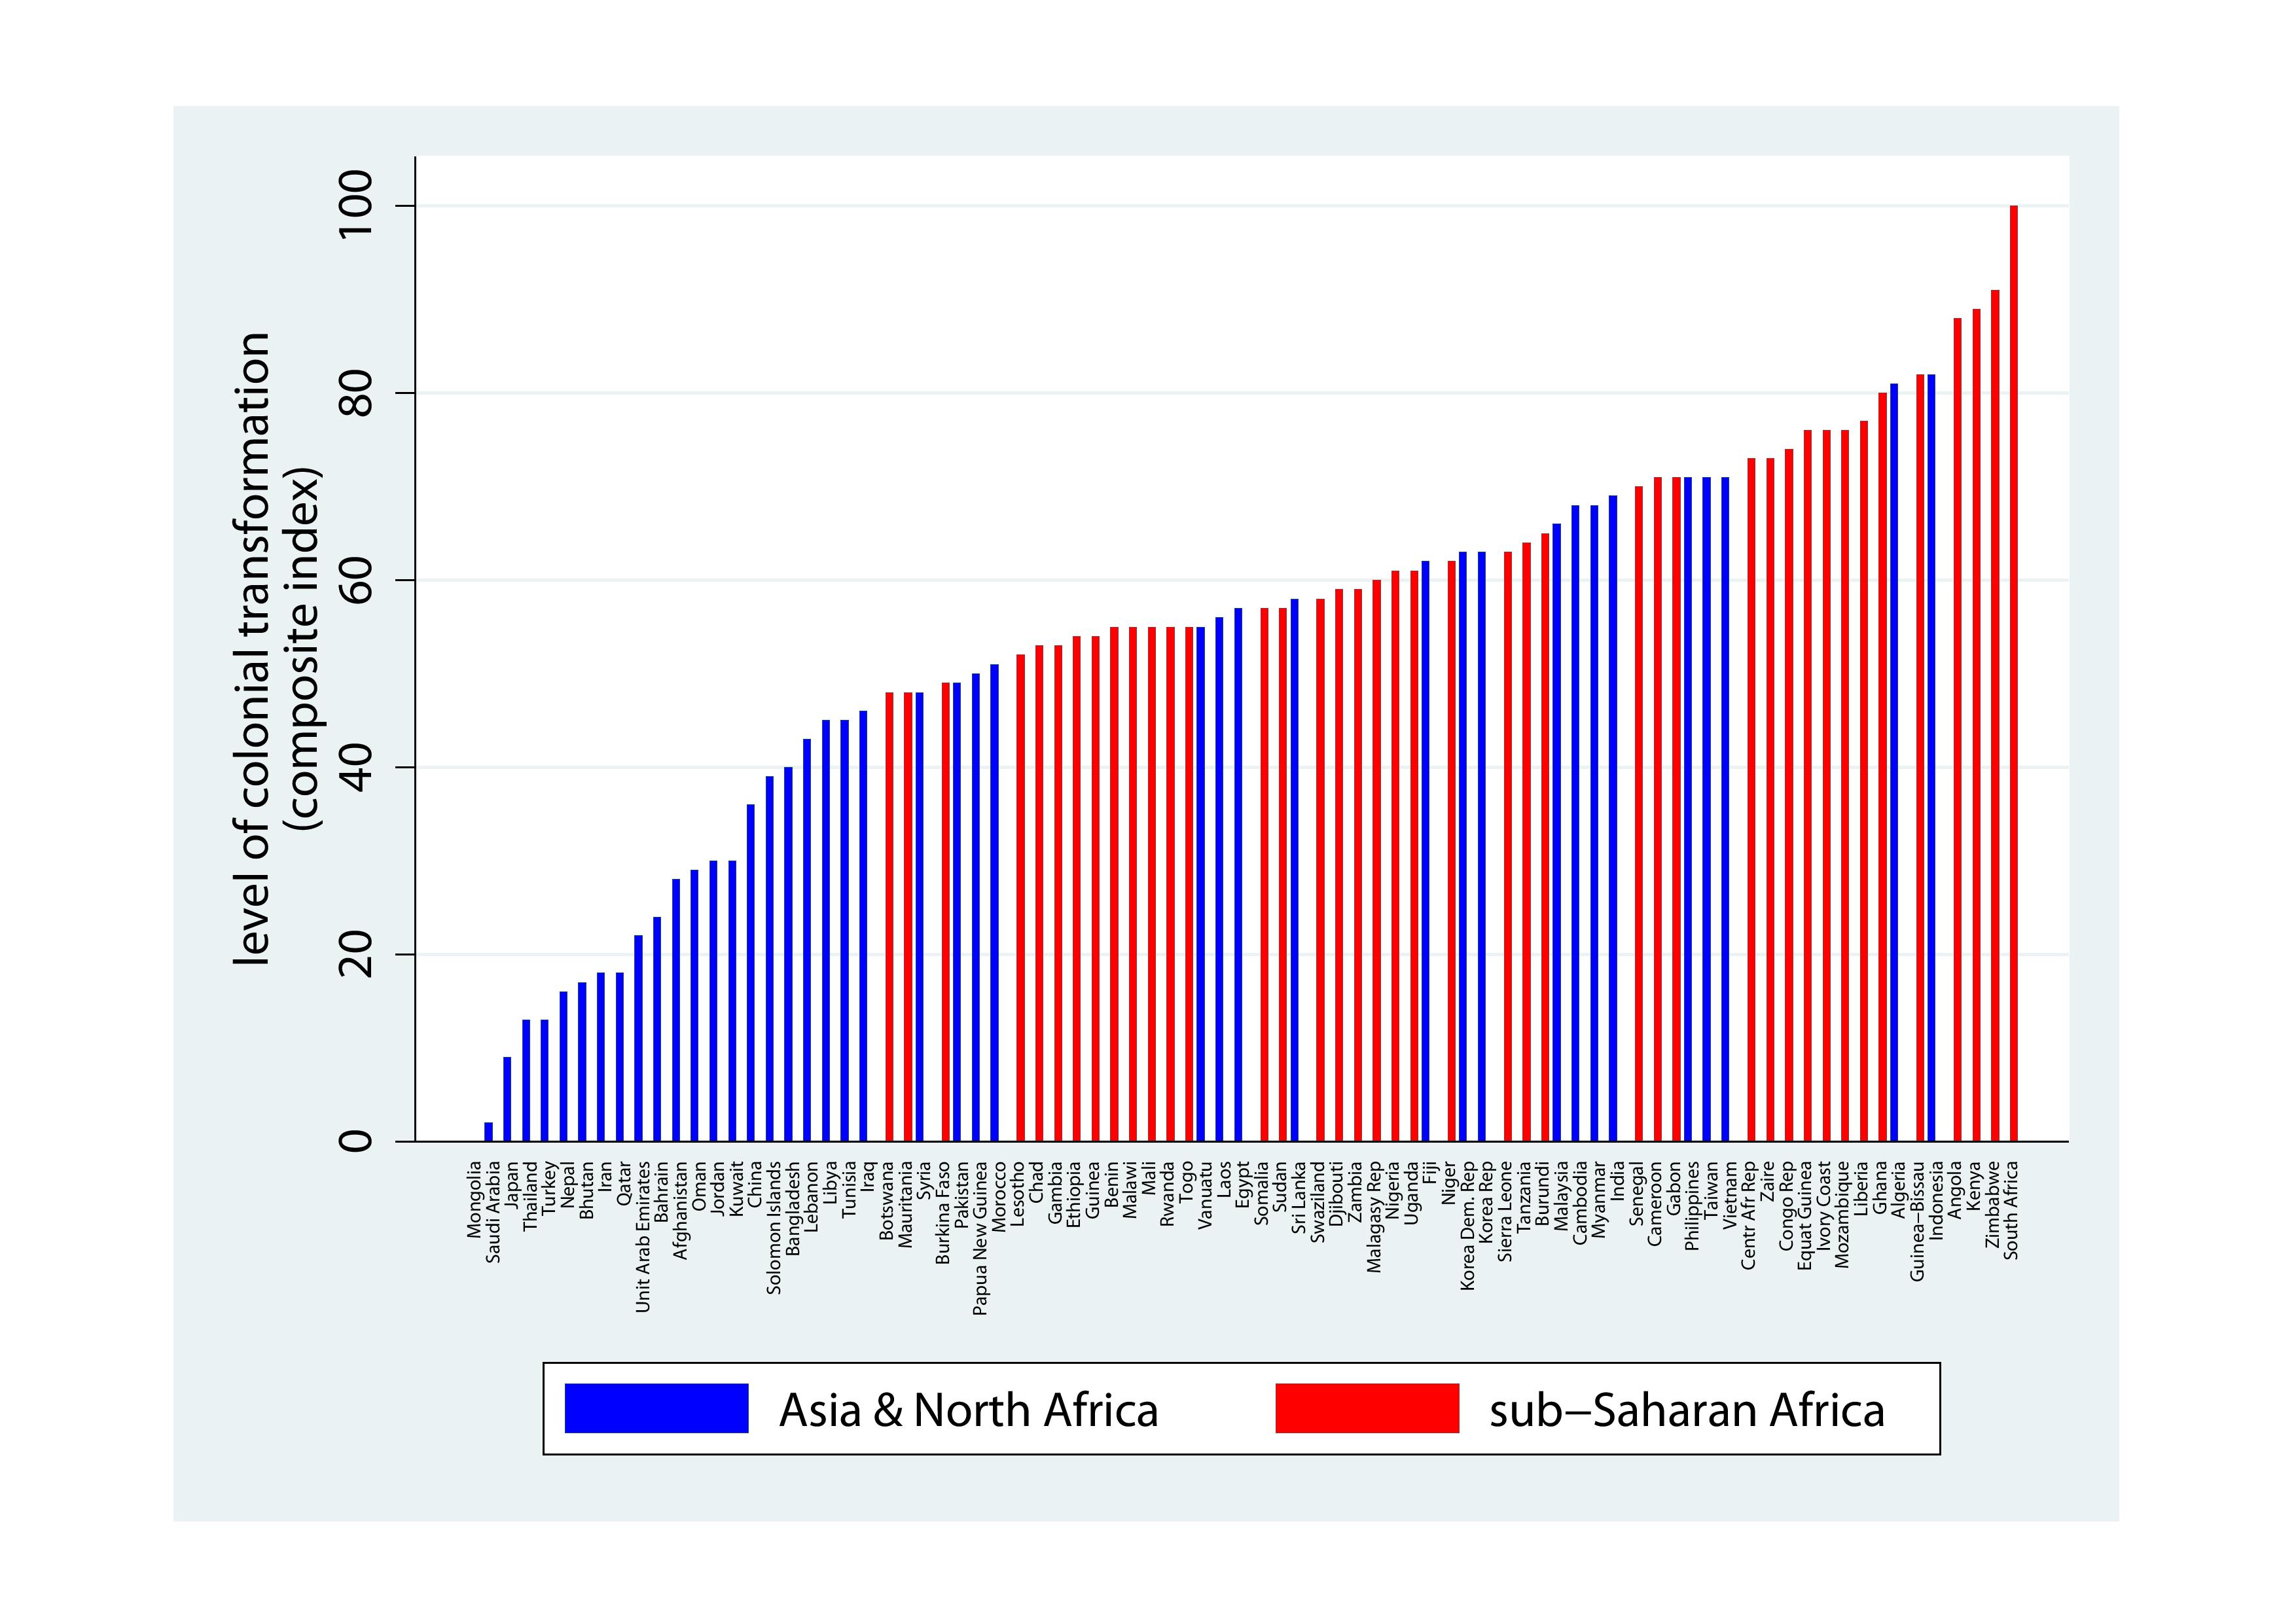
The index for colonial transformation (“total impact”) was computed with the three indices above.
The ranking given in the graph summarizes the main result of our empirical analysis of the impact of colonialism: The countries of Africa/Asia have been transformed through colonialism to very different degrees. While quite a number of Asian/North African regions did not experience a significant transformation though colonialism, especially around the Persian gulf or in Central Asia, almost all of sub-Saharan Africa has been transformed, in several regards. Unsurprisingly, South Africa has the highest value of all countries in our sample – no country has looked more different before the onset of colonialism and today. Others have changed their character fundamentally after decolonization, by expelling colonial settlers and work immigrants through more or less bloody campaigns, by destroying or re-directing the colonial economy. However, in none of these cases it was possible to turn back time to the pre-colonial situation. The widely different impact of colonialism, dimensional as geographical, as shown as the result of our empirical analysis, has to be taken into account when assessing its long-term effects.