Sexual Division of Labor
Sexual Division of Labor
In pre-industrial societies, the division of labor between men and women takes many different forms. The Ethnographic Atlas of G.P. Murdock distinguishes between five different categories of subsistence economy: gathering, hunting, fishing, herding, and agriculture. In the Atlas, each area is coded for the extent the activity is performed more by men, more by women or by both both sexes about equally.
In the following, the sexual division of labor is represented in two kinds of maps. They are showing:
- The involvement of men and women in the agricultural work – if agriculture plays a dominant role (see Codebook: „V64“). This information is given on local level (point map Labor division in agriculture, and the two extracts further down).
- The proportion of men and women in the two most important subsistence activities (see Codebook: „Asymmetric Work Distribution“, AWD). This information is given on national level (see country map below).
It goes without saying that people are involved in many more relevant activities other than subsistence work. Therefore, the map is does not show a working balance of the sexes and the variables in no way are indicators of sexual exploitation.
Map extract East Asia: Division of labor in agriculture (if relevant):
| The section reminds of the Chinese divide into a northern and southern part known from the subsistence map: In the northern part where crops and rain-fed farming dominate, men and women are equally busy in agriculture (pink shade); in the southern part with irrigated rice production, men are more involved in agricultural work than women (blue shades). The observation is in line with the evolutionary tendency in agricultural societies that growing total workload (pushed by population increase and more social hierarchies) calls for higher involvement of men in the work process. |
|

The situation is more heterogenous in the southeast: Vietnams reveals a typical „rice pattern“ with a strong involvement of men in agricultural work; in Thailand and the Philippines, the agricultural workload is more equally distributed in spite of common – but not always irrigated – rice production; and the tribal groups in the mountainous Laos/China border areas show a proportionally higher involvement of women. It is interesting to note that the pattern of equal distribution of work in irrigated agriculture is correlated with cognatic status transfer.
A clearly male dominated agriculture is distinctive of areas under arabic-islamic influence in North Africa and parts of West Africa. Economically, they strongly depend on animal husbandry. Further south in the forest farming zone, agricultural production is firmly in the hand of women.
Map extract Northeast Africa: Religion, Subsistence and male involvement in agriculture
| Ethiopia is an old christian country. In the two main ethnic groups, the Amhara and Oromo, men are more involved in agricultural work than women. The same is true in the arabic-islamic Yemen. In both countries, the backbone of the agricultural system is exposed in the impressive terraced landscape (not so different from Luzon in the Philippines). Obviously, the degree of involvement in agricultural work is not connected with religion but reflects plough cultivation in state societies. Under such structural conditions, tribal structures and male political domination get eroded and men are forced to work „in the sweat of their brow“. |
|

The white circles point to (nomadic) herders with no or very limited agricultural production. The patriarchal power structure in these societies continue to determine the sense of collective responsibility of men even long after forced sedentarization. This reminiscence could explain most of the blue circles which are dispersed over Uganda and Kenya. In fact, the Language map reveals that many of these societies belong to the Nilotic-Sudanese language family, i.e. societies which immigrated from the north
Map: Extent of Sexual division of labor in the two most relevant sectors of the subsistence economy
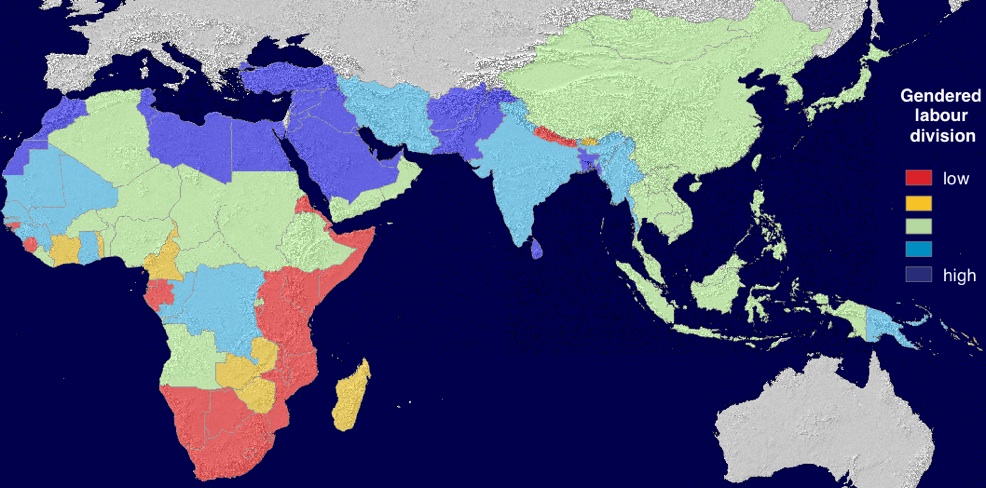
As the map‘s title indicate, the figure exposes a variable different from the two extracts above. There, the question was: Who (men or women) is more involved in agricultural work – if agriculture contributes to at least 50 percent of the local food consumption (as is the case in the large majority of local societies). In contrast, the large map showing national units displays something very different. Here the question is focused on the principle of gendered labor division as such. Instead of asking which sex contributes more to the agricultural output, the question is: To what extent is there a gendered labor division traditionally observed in any of the five sectors (gathering, hunting, fishing, animal husbandry and agriculture) – irrespective of who (men or women) are contributing more. Local societies are coded „high“ if there is a clear sexual division of labor in all activities, „low“ if such divisions are unimportant. As usual, the national value is a population weighted (and standardized) sum of the local cultural units.
In broad outline, one can draw some general conclusions:
- In terms of sexual division of labor, the African continent is highly diverse.
- There is broad belt, running from West Africa through the Arab world till Burma (excluding Nepal and Burma!), where sexual division of labor is strongly developed – mainly in the sense of: men contributing more to subsistence. The two Central African countries with strong sexual labor division, however, are examples of the female forest economy where women do most of the subsistence work.
- Low sexual division of labor is not very common and if so, mostly in eastern and southern Africa.
- China, Southeast Asia and the African Sahel are the areas where the index is on a middle level.
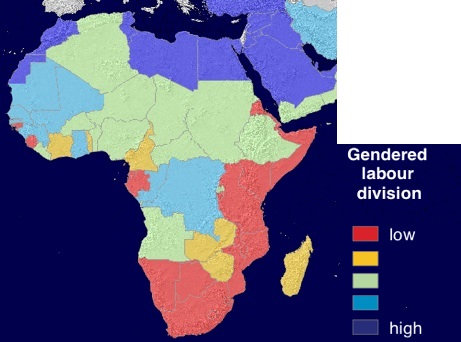
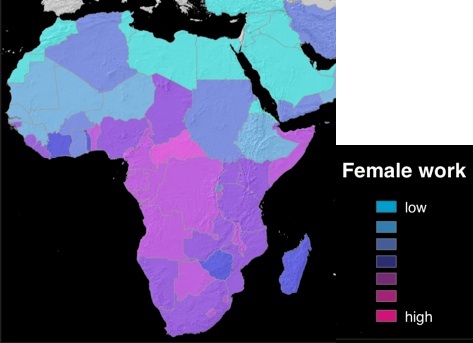
The indicator used for the map of „gendered labor division“ is more general than the indicator visualized in „Female work“ (in agriculture) since it covers all subsistence activities. However, as mentioned above, it does not reveal who is doing more work in each of the five sectors, if any labor division is observed. One gets the full picture by comparing the two maps (see map extract below):


Comment on the two maps:
The map on Female work (in agriculture!) is unfortunate in two ways: First, it is meaningful only for countries with clear-cut labor division in agriculture. If labor division is low or, when there is much labor division but agriculture is not relevant, the information of the map on the right does not make much sense. Second, the choice of the colors takes a little getting used to: The extremes are light, the middle levels are dark. In addition, the two maps have different classifications (5-point and 7-point scales). Therefore, the maps will be redone in due time in order to ensure comparability.
Keeping this reservation in mind, an enquiry about the countries in blue and – to a lesser extent – in green (on the left) can be fruitful. Examples:
- In North Afrika, high labour division means low female work.
- Niger and Chad fall into the same (middle) category of general labor division. However, Female contribution (in agriculture) is much higher in Chad (like in Nigeria) than in Niger.
- Congo and Zaire both have a relatively high proportion of people from cultural groups with high gendered labor division (like Mali, Senegal, Guinea etc.). However, labor division has a different quality in central Africa from the countries in Northwest Africa: In central Africa the workload in agriculture is with the women, while in the Northwest the main responsibility for the subsistence rest with the men.