AgroTechnology
Agricultural development (ATE)
ATE – the Agro-Technical Development Index – is composed of two groups of ethnic variables. They all serve as proxi-variables of surface area productivity:
- Three agricultural variables:
R28: fertilization;
R29: grain cultivation (as opposed to tubers);
R39: plough cultivation (as opposed to hoe-farming). - Three technical indicators:
R40: draft animals;
F44: metal working;
R46: weaving.
The ATE-index is one of two mainstays of a society‘s structural complexity. The second mainstay is the level of socio-political differentiation (SPD). In statistical regression analysis the two indexes prove to be strong and robust determinants of modern development. Please note that the six ATE-indicators are consistently interrelated (cf. correlation table, left side). The index is designed as unweighted sum of the six components.
Correlation table (PDF, 93 KB)
In traditional agriculture, increasing outputs per acre/hectare required a disproportional increase of labor-input per consumable calory. Since increasing productivity per surface unit is absolutely essential when population increases, and for the progress of civilization, cultural evolution had to be obtained by increasingly hard work. The process also implied more disciplining of agricultural producers in favor of urban consumers and non-agricultural diversification. Only when modern agriculture with industrial inputs emerged, the combination of increasing output of surface and labor became reality. consumers and non-agricultural diversification.Only when modern agriculture with industrial inputs emerged, the combination of increasing output of surface and labor became reality.
The different regions of the world differ from each other with regard to the level of precolonial agro-technical development. As a general rule, Asia and North Africa show high values. The lowest values are found in Melanesia; African forest agriculture occupies the middle field.
The agro-technical development is displayed on two different maps: one showing the values (6-point scale) of the ethnic units, the other showing national averages (again on a 6-point scale). The two map extracts of the identical area (below) demonstrate the higher information density of the point map.
The ethnic point map
The colors signify different ATE-levels on a 6-point scale. Obviously, the scale is rather rude: In East and Southeast Asia, only three levels dominate:
- intensive plow-agriculture with irrigation (blue).
- intensive rainfed plow-agriculture (green).
- middle intensity level: non-plow tillage in the hills (yellow, white).
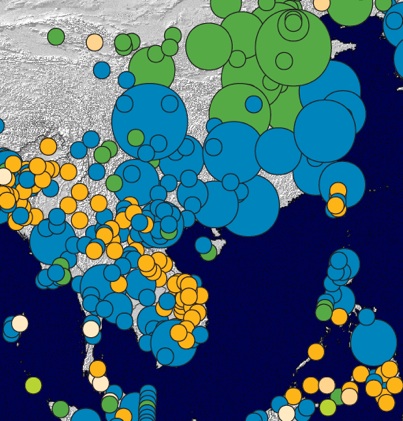
The two ocher-colored circles in the northern part symbolize nomadic herders with some additional tillage. The number of groups with simple and complex technology roughly balance each other. However, the number of people stemming from less complex societies is much lower than those with a cultural heritage of high agro-technical complexity. This difference explains the uniformity of values on the map with national averages (below).
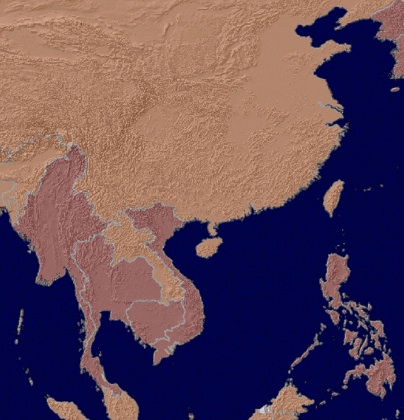
The country map
The map of Africa and Asia distinguish between six different ATE-levels. Particularly in large countries like China, or India the lack of internal differentiation is unfavorable.
Since the ethnographic information is coded for all the Chinese provinces and Indian states, it would be possible to display subnational differences (as in China, see pdf below). This possibility was discounted for two reasons: (a) The maps intend to visualize the cultural indicators on the same level as the development indicators with which they are correlated. Since these indicators usually are published on national level, so should the indicators of the cultural heritage be. (b) Subnational units change and split more often than national units. Working on this level implies a methodological complexity which was avoided, at least for the time being.
The two forms of displaying cultural data have pros and cons:
- The points give an insight into national differences. On the other hand, the image mof large areas may get overloaded and unclear.
- Country maps provide a rough picture, but lack differentiation. Even small countries may exhibit large internal variation, and national borders often cut related areas.
At a first glance, one may wonder why China as a whole does not display the highest ATE-values despite of intensive agriculture and traditional technical sophistication. The explanation is partly technical: In the ATLAS, irrigated agriculture gets a higher intensity code than rainfed agriculture which is dominant in large parts of northern China. Moreover, the agricultural systems in the central and western parts of China – though less populated – have a lowering effect on the national average. In this respect, the Southeast Asian countries (except Laos) are more homogenous.
The above mentioned difference between the number of ethnic units and number of people involved is crucial for an understanding of the ATLAS. It reflects the difference between Social Anthropology and Sociology. In Social Anthropology, the relevant unit is the cultural unit, defined as a set of institutional arrangements or as a reproductive collective, whatever its size. In sociology, as in political science and development theory, the number counts. The two views reveal different realities – see figure below:
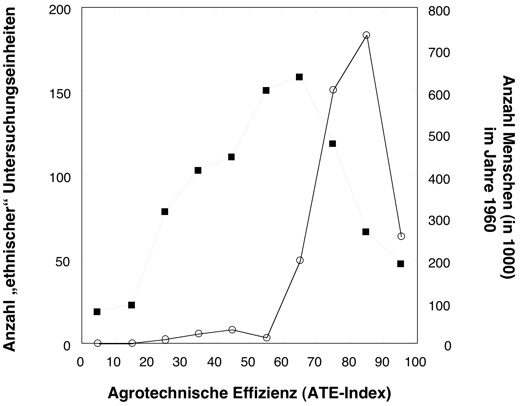
Comment:
The curve of black points approximates a normal distribution. It shows the number of cultural units (left scale) in Africa and Asia per ATE-category on a 10-point scale (x-axis). Most common are societies at a middle ATE-level.
The compact curve shows the number of people (right scale) per ATE-category. Demographically, the lower part of the ATE-scale – i.e. more than half of all coded societies – are nearly negligible. By fa the greatest part of the old-world population are descendants of societies which traditionally exhibited a high agro-technical development level.
Distinguishing number and size of cultural units is important. On the hand, we find a large number of societies with small population, on the other hand a small number of societies with a large population. From a development point of view, the cultural heritage of the few large societies has much stronger impact than the beautiful diversity of the rest. Therefore, in the ATLAS, the cultural indicators of a country are constructed as the sum of demographically weighted ethnic codes.
The number and proportions of ethnic groups still deserve attention: They define the cultural homo- and heterogeneity of a country which is a strong factor for national cohesion and conflict management – hence of development.