Complexity
Societal Complexity (CXTY)
The term Structural Complexity is an abstract index of the precolonial „level of civilization“ applicable to ethnic units and contemporary countries. On the ethnic level, the index is calculated in two ways: Either as the sum of the two components:
Structural Complexity = ATE plus SPD.
Or as a resulting dimension of a principal component analysis with main loadings of ATE- and SPD-variables (always the first and strongest factor).
As elements of a functional system, the two components are highly correlated. It is not surprising that larger, politically centralized, economically and socially differentiated societies have agricultural systems with higher productivity. However, two obervations are suprising: (a) that the indicators of the ATLAS reflect this reality so precisely and (b) that precolonial structural complexity is able to predict postcolonial development so strongly (Ziltener/Müller 2007).
The following model shows the empirical relations between three indicators of societal complexity and development:
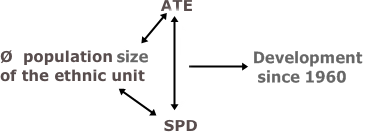
The correlation between ATE and SPD is highly significant at both the ethnic and national level (see two scattergrams below). The size of the symbols (ethnic and national) corresponds to the population size of therespective units.
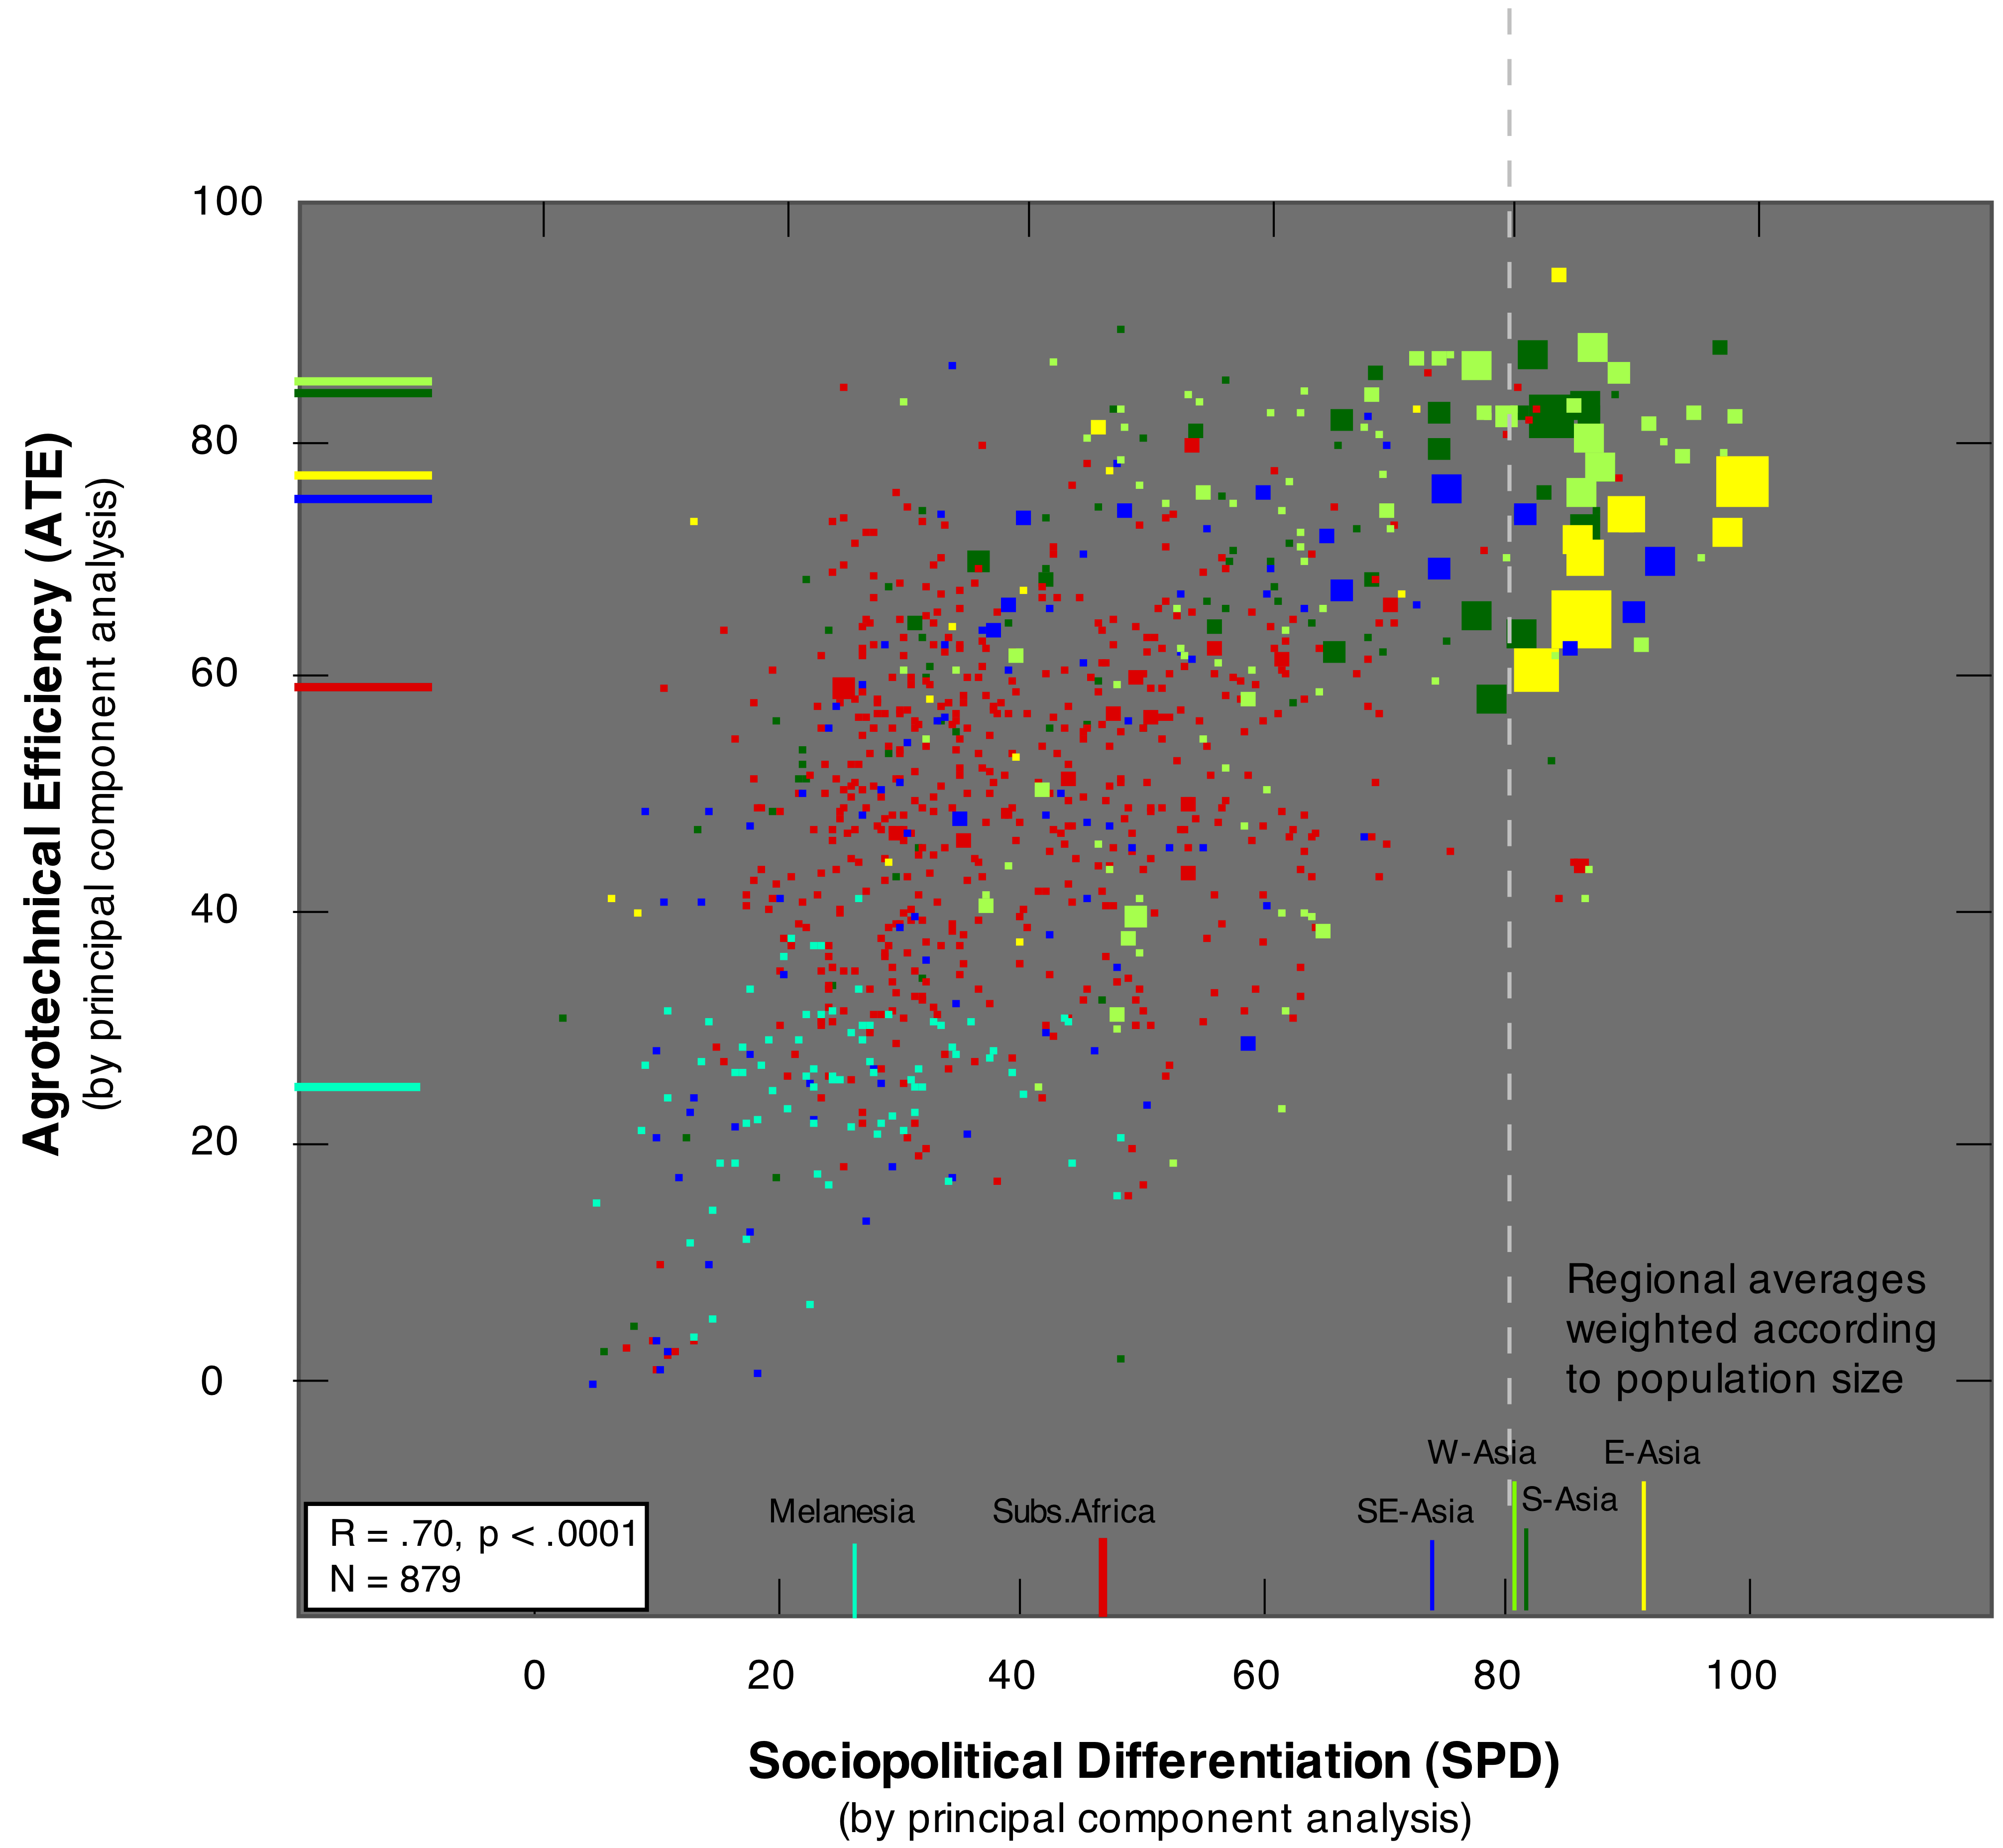
Comment on ethnic level:
1. The six colors represent geographical regions: Sub-Saharan Africa; North Africa and West Asia; South Asia; East Asia; Southeast Asia and Melanesia.
2. The color bars at the horizontal and vertical axes indicate the population weighted average ATE- and SPD-score of each region. The vertical dotted line marks the weighted SPD-average of all units.
3. It is striking that the regional averages of ATE and SPD values do not follow the same order: e.g. East Asia (yellow) is highest in SPD, but on the third position in ATE, behind West Asia/North Africa and South Asia. This discrepancy reflects the vast areas with rainfed (instead of irrigated) agriculture in China, but also the growing lag of agriculture behind the demographic increase in historical China. Nowhere in the world was Western agrarian technology more wanted than in China of the 19th and 20th century.
4. The overall correlation (R) is .58 (0.01>p). The correlations are weaker within the areas than between the areas. It is weakest between the units of sub-Saharan Africa (red points).
The functional nexus of the two indicators (ATE and SPD) is also apparent on the national level (cf. next graph). It has been universal in the past and will not disappear in the foreseeable future. Increasing population density entails further socio-political differenciation and will force higher agricultural productivity The indicators are changing, but the abstract logic will remain unchanged.
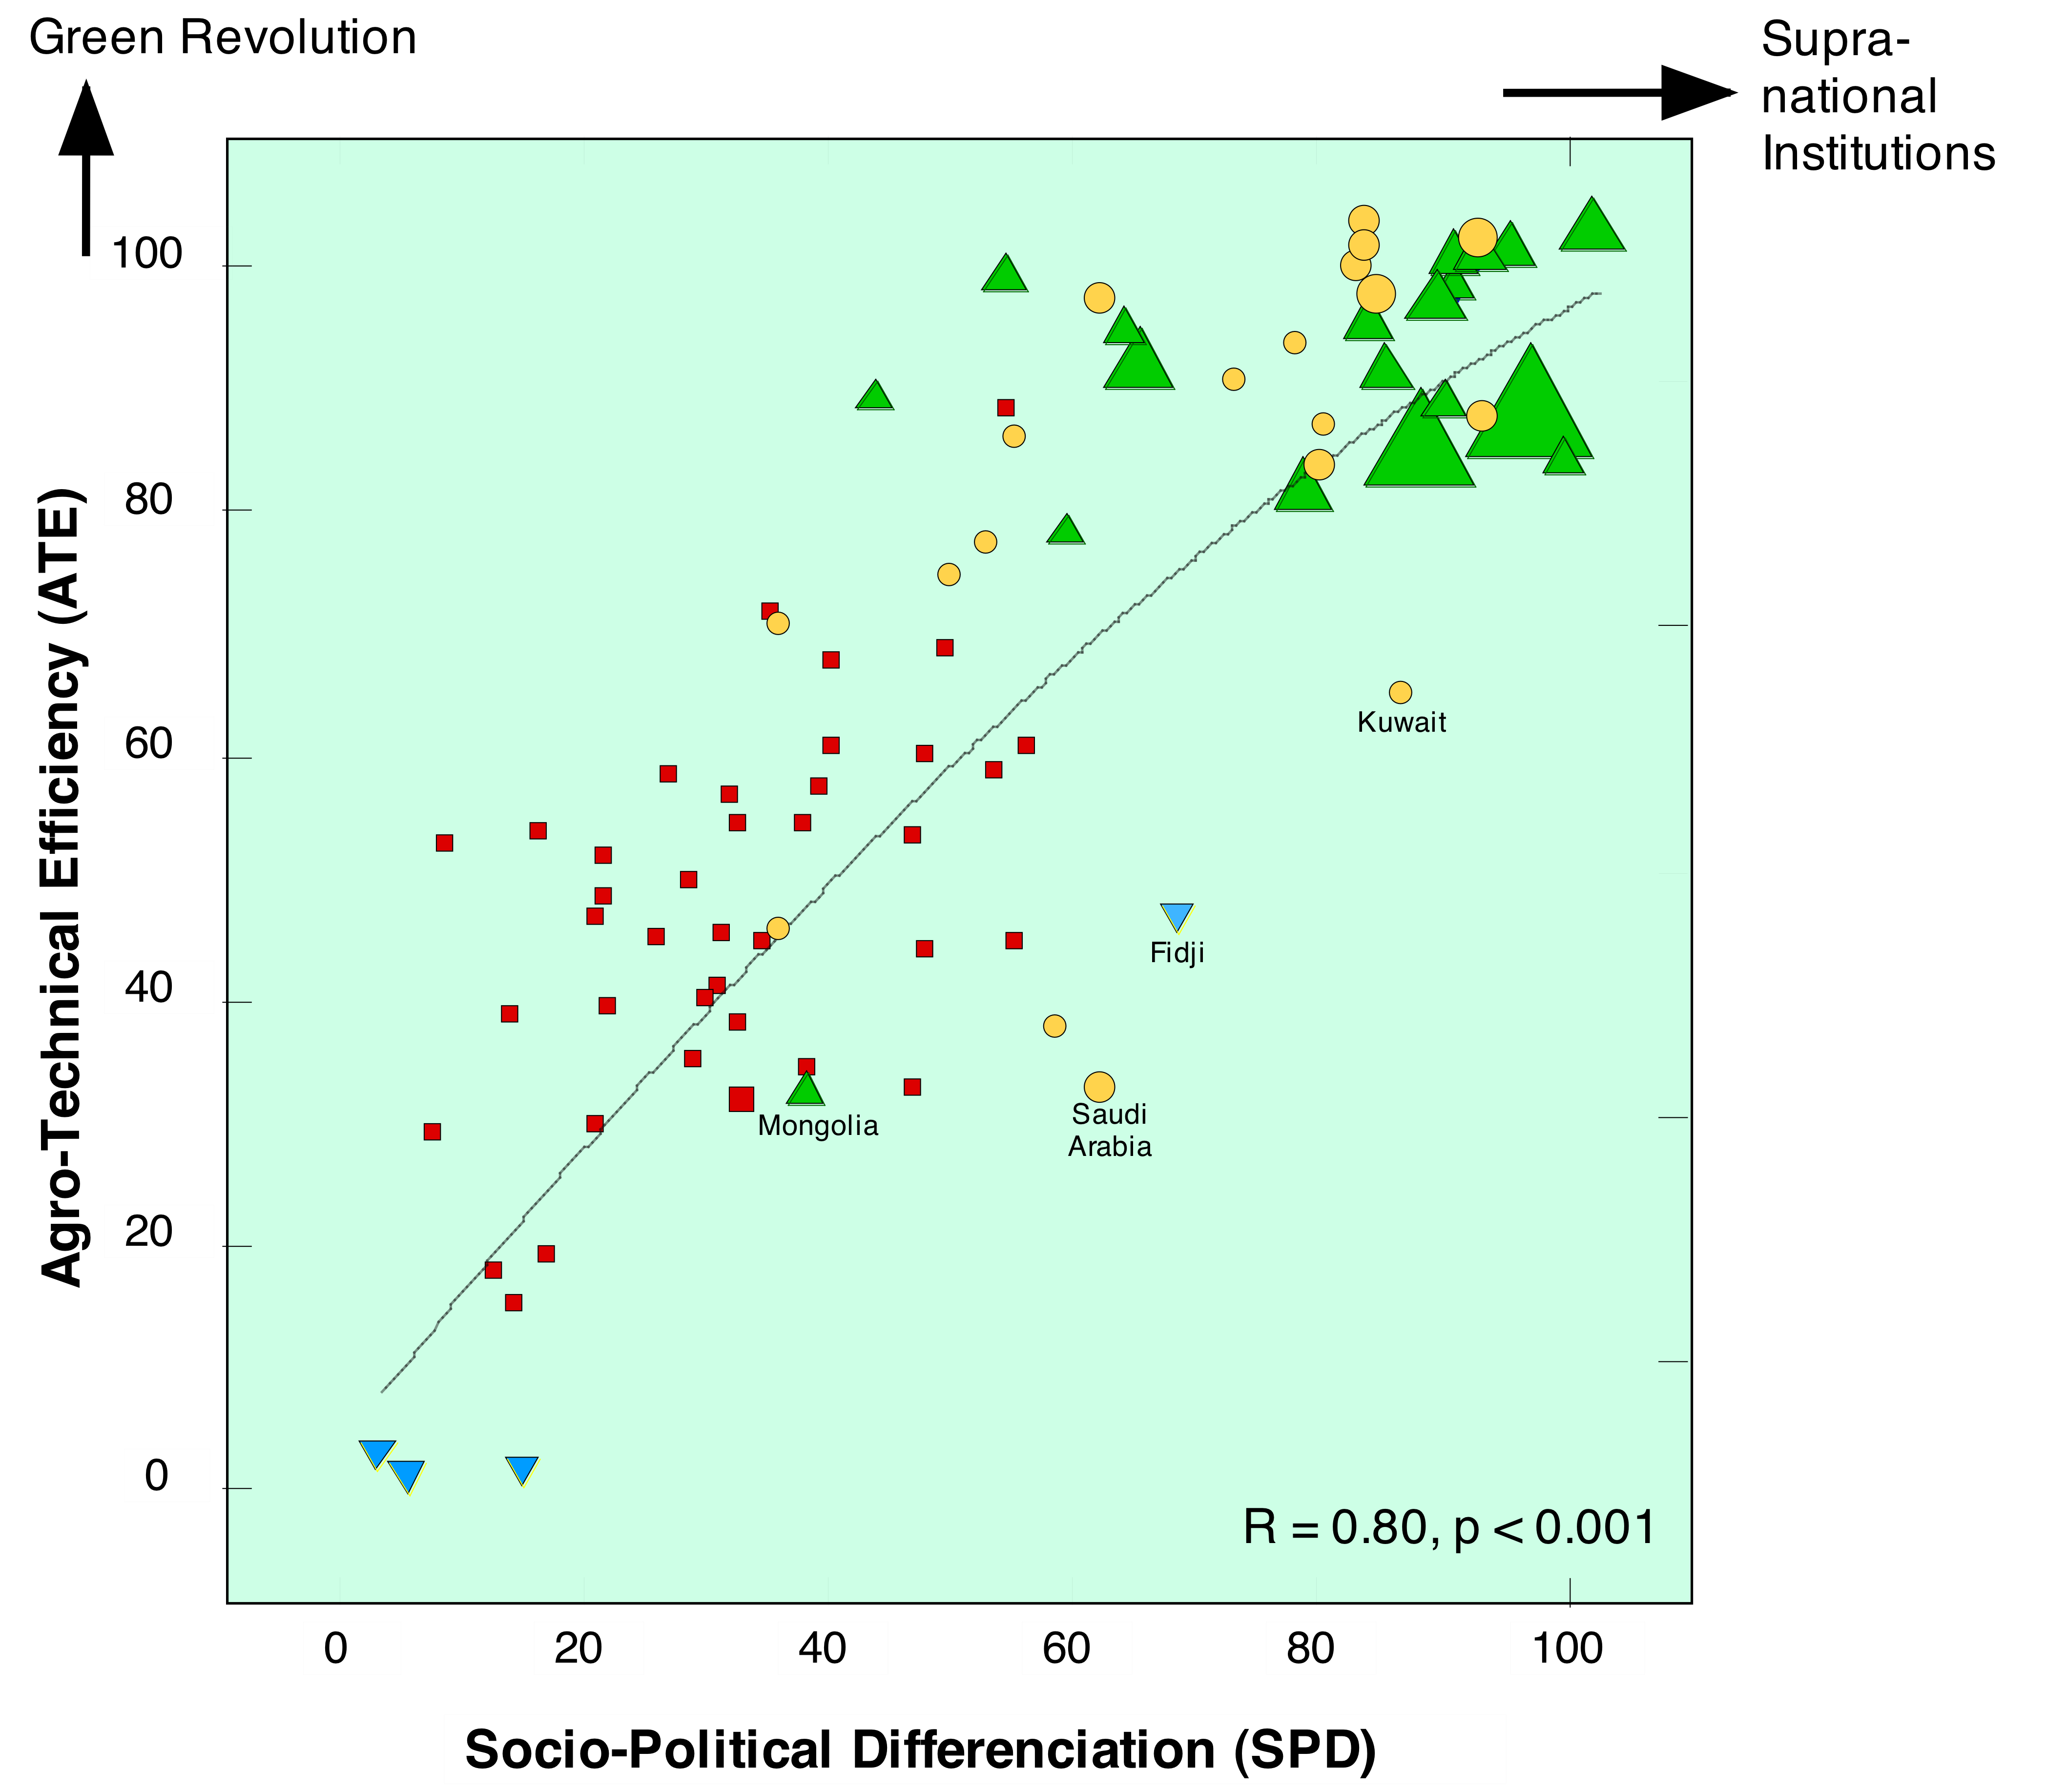
Comment on national level:
The scattergram shows aggregated ATE- and SPD-values of 95 African and Asian countries. In contrast to the figure with ethnic units above, four regions are shown: Melanesia (blue), Africa (red), Arab countries (ochre) and Asia (green).
As a rule, East- and West-Asian countries show high ATE-values but differ much in SPD; sub-Saharan countries dominate the lower half of both dimensions. Oceanic islands are at the low-left corner.
Special factors operate in Mongolia, Bhutan, Nepal (landlocked mountain regions), Saudi Arabia and Kuwait (ethnic differenciation between mobile and sedentary subsistence economy), and Fidji (Indian immigrants)..
The correlation of the traditional agro-technical and socio-political values is also visible when the subsistence map (ATE) is compared with the socio-political map (SPD). Generally speaking, Melanesia and most of the sub-Saharan ethnic units occupy the lower half, the Asian societies the upper part of the scale. The two clippings below show the same region, with SPD and ATE-values, respectively.
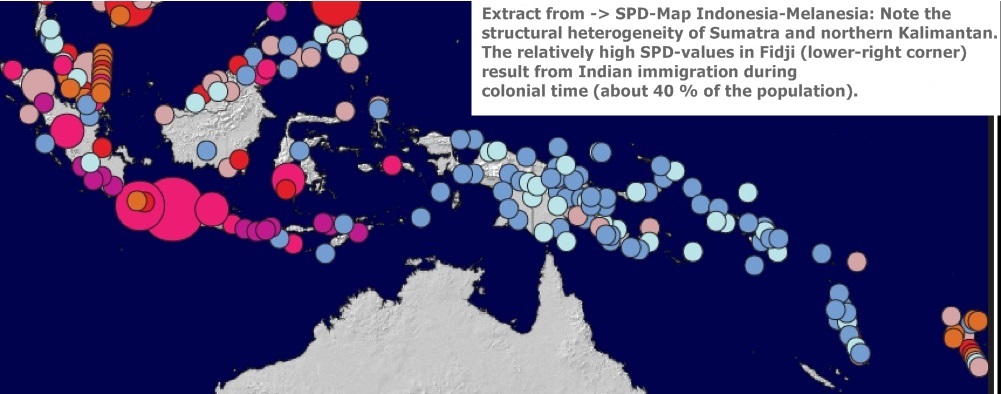
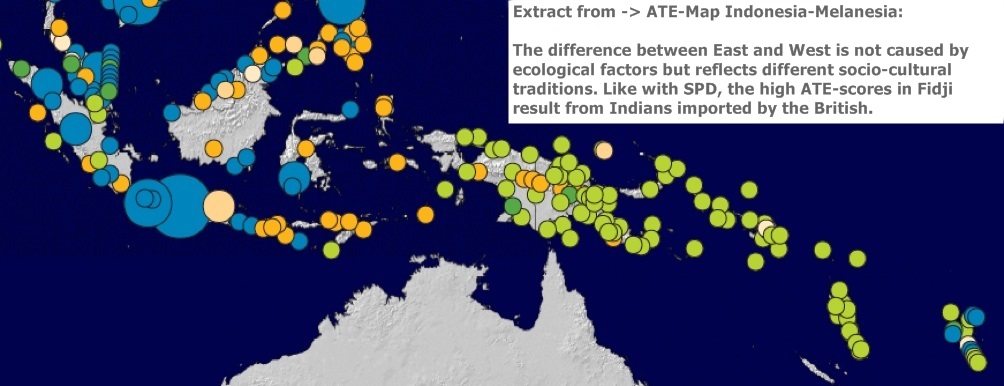
When comparing the two maps, it should be noted that the agro-technical index is more differentiated in the upper part of the scale: Irrigated agriculture gets a higher score than intensive non-irrigated agriculture, though the carrying capacity may be equally high, allowing for about the same level of socio-political differentiation.
On the other hand, the SPD-index is more detailed in the lower part of the scale and comparatively insensitive to socio-political differences of complex societies.
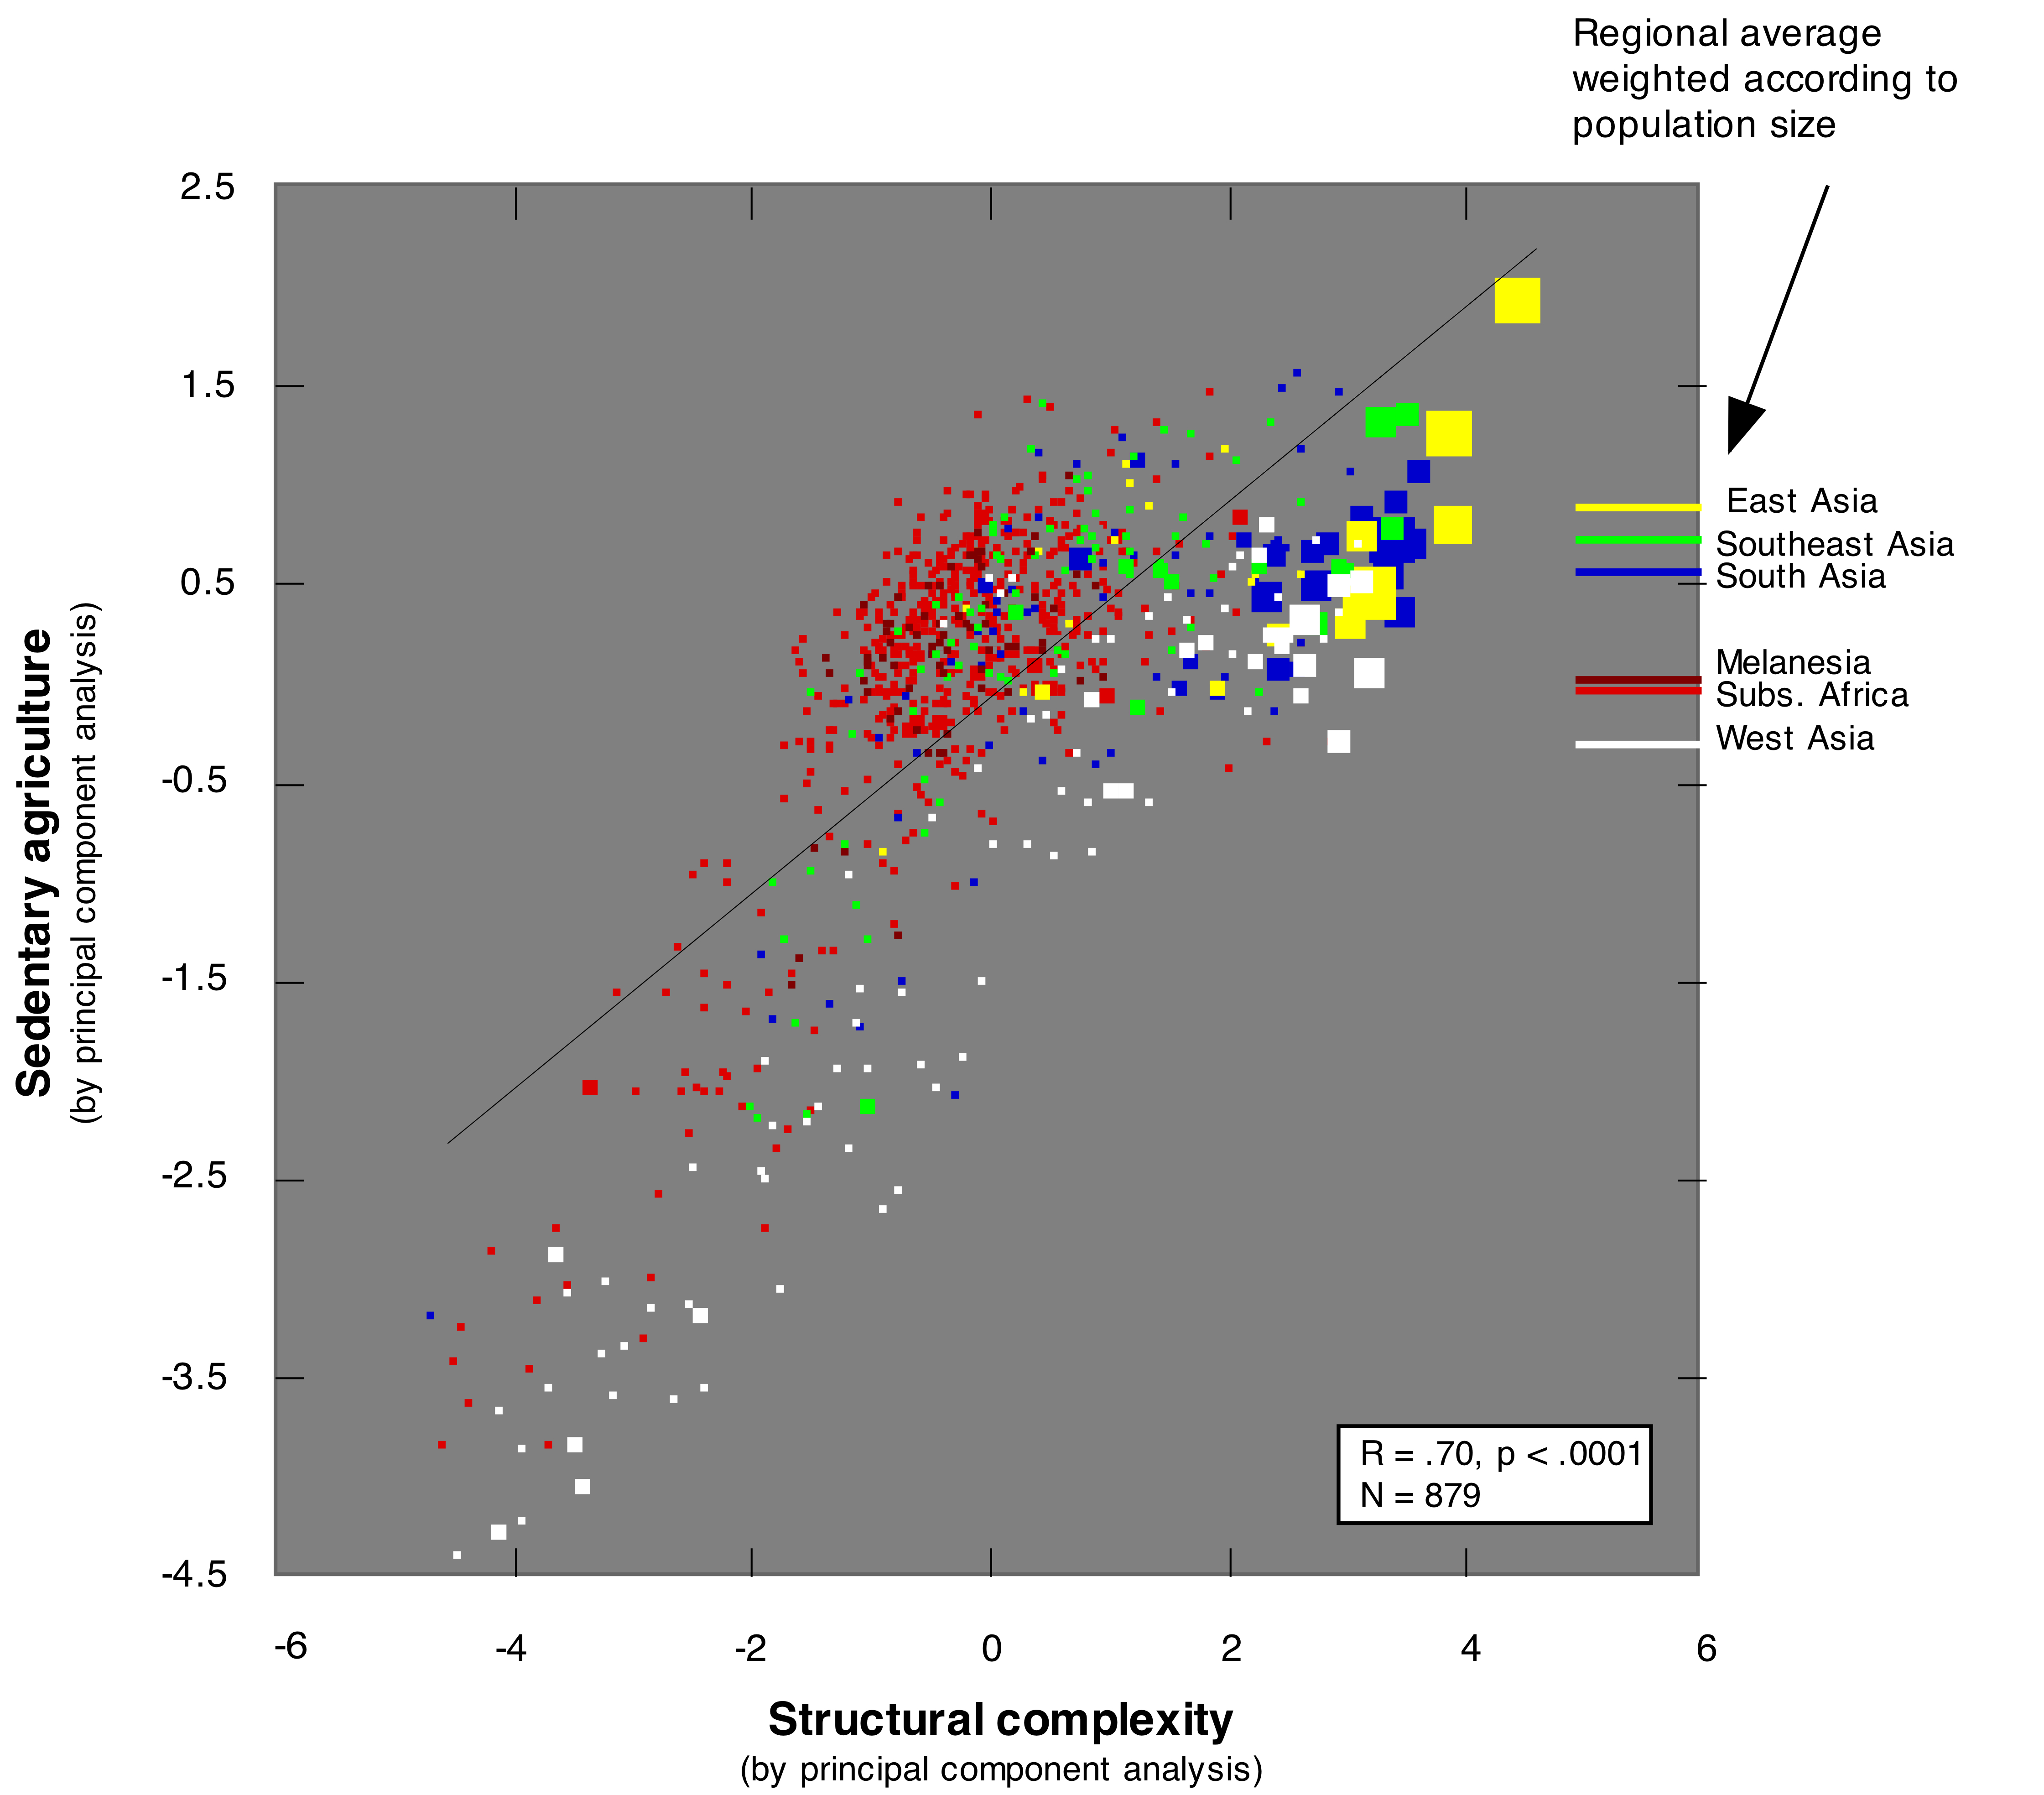
Comment on scattergram:
1. The dimension "Sedentary agriculture" indicates the relative importance of nomadic cattle-raising and animal husbandry based on sheeps, goats and pigs (at the lower end) as against sedentary agriculture with bovine animals and cereal production, on the high end.
2. The dimension "Structural complexity" is defined by the level of socio-political stratification and population size, combined with intensity of cultivation (plow and fertilizing).
3. The relatively low structural complexity of most sub-Saharan societies (red points) results from the specificities of African forest agriculture where intensive plow cultivation is mostly absent which is, by definition, limiting structural complexity.
4. In contrast to the first scattergram above, the correlation not only holds between, but also within each of the six regions.
The overall correlation refers to two distinct and broad cultural complexes: in the lower half, various configurations of nomadic herders with a tendency to patrifocal kinship organization and islamic religion; in the uper half, configurations of various horty- (center) and agriculturalists (upper-right). It should be noted that the distincion between pastoralism, based on animal converters, and agriculture, based on vegetable converters, first of all reflects adaptations to different environmental conditions, with strong impact on the structural complexity of the society as a whole.
More about sedentary agriculture (PDF, 74 KB)
More about Complexity:
Theoretical Discussion