Sub-Saharan Africa
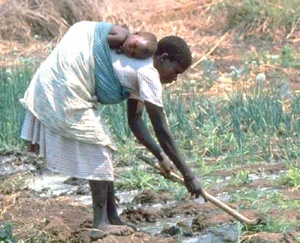
Sub-Saharan Africa comprises four Identification maps (ID-maps) with 41 countries (see the table below). Contrary to the Asian continent, clear-cut cultural majorities are exceptional in Africa. In 35 of the 41 countries coded in sub-Saharan Africa, the largest cultural unit does not reach 5 percent of the national population. Only five rather small countries are ethnically homogenous: Somalia, Swaziland, Equatorial Guinea, Rwanda and Burundi.
Compared to other areas of the ATLAS, the size of cultural units in sub-Saharan Africa (as well as in Melanesia) is clearly below average. This is due, on the one hand, to high ethnic fractionalization since central political institutions usually were absent, fragile or shattered. Hence On the other hand, it is a reflex of a particular anthropological bias for small „tribal“ structures – not entirely coincidental, but not always requested by facts. As a result, ethnic units often show identical codings and could as well subsumed under an overarching label – if there were one.
Map West Africa: Extract of the golf of Guinea
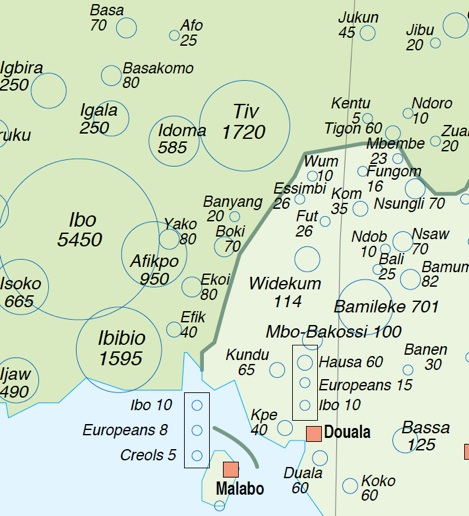
In Nigeria and Cameroon, the three largest ethnic units show about the same proportions of the national population. However, the absolute size differ: In Cameroon, the 17 % Bamileke total about 700‘000 persons; in Nigeria, the 15 % Ibo total about 5.5 million (all figures 1960).
Cultural Fractionalization of West Africa (PDF, 50 KB)
The clip is crossed by a least three different boundaries only one of which is displayed:
- The national boundary separates the people of West Cameroon from those of Nigeria. From Nigeria they have been governed from 1915 to 1961.
- A language barrier runs between the English speaking West Cameroon and the French speaking East Cameroon. After the German‘s lost the first world war, the dominant French part of the country has been governed by France till 1961.
- A structural barrier runs between the small kingdoms in the hilly parts of West Cameroon (from Bamun to Wum) and the dumpy lowland populated by acephalous forest people towards Nigeria.
The colonial impact on local languages, social organization, economy and law has got deep and long-lasting effects. Since external forces interacted, and still interact, with pre-colonial conditions, „ethnic“ structures and „ethnic“ processes more and more get the result of a common history.
Map Northeast Africa: Extract of Sudan
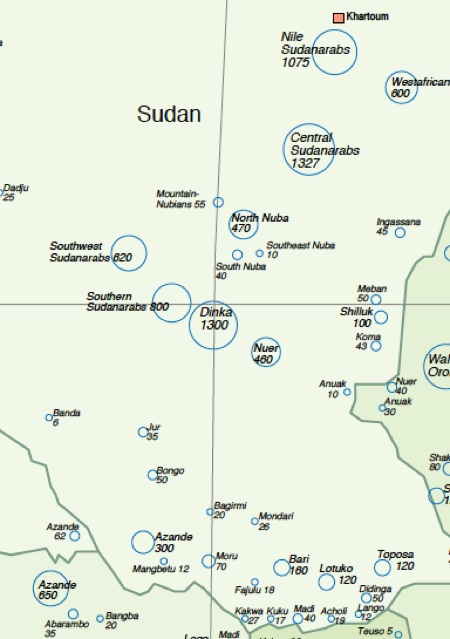
Sudan exemplifies the amount of interpretation in the definition of the cultural („ethnic“) units of the ATLAS. What criteria should be relevant in which situation?
- Language/Religion: With a proportion of about 50 %, the arabic-islamic population in the northern part of the countre constitute the largest group. They are opposing the animistic-christian „Nilotes“ and other groups in the South.
- Economic system: The distinction between nomadic, semi-nomadic and transhuman subsistence techniques offers a valid structural categorization for the Arab population. It supersedes controversial categories based on distinctions of tribes and clans which are so relevant for self-reference and collective identity.
- Geography: With intent to indicate areal population distribution, some groups of identical codings were kept separate (see e.g. various „Sudanarabs“).
- The non-Arab population usually is classified in seven clusters. For example, the Nubians are believed to be the oldest settlers of the Sudan; the term Beja embraces several nomadic groups; Dinka cattle breeders form the largest negroid groups etc.
Map Central Africa: Extract Rwanda, Burundi

Most noticeable is the high population density in the area, compared to neighboring Zaire and Tanzania. Rwanda and Burundi show one single unit only, representing 100 % of the national population. This may appear counterintuitive in view of the conflicts between Hutu and Tutsi in both countries. The reasons are:
- Not all conflicts in African countries are ethnic conflicts just because they take place in Africa. According to the ATLAS – as well as the Ethnographic Atlas of G.P. Murdock – , Hutu and Tutsi are endogamous castes in precolonial kingdoms, not ethnicities.
- Hutu and Tutsi talk the same language, they share common religious beliefs. They are scattered over the whole territory of the kingdom. Traditionally, Tutsi are herders and Hutu farmers. However they overlap widely since common Tutsi live from farming as well. The real difference in in the field of rituals.
- Under colonial influence, an ethnic identity developed along caste lines. This relatively recent process, however, is not taken into consideration in the ATLAS of Precolonial Societies.
Map Southern Africa: Extract of South Africa
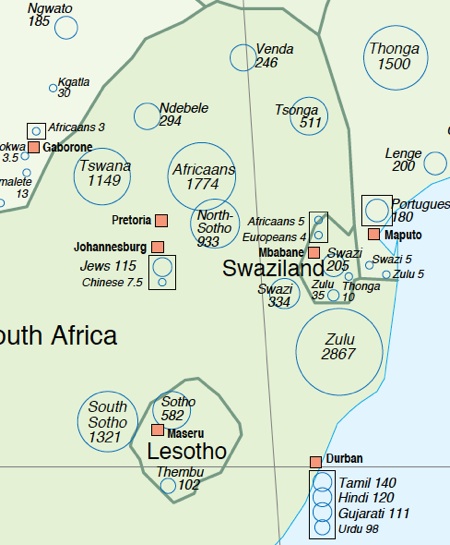
South Africa is a borderline in the sense that the methodology of the ATLAS is struggling to correctly comprehend the social reality and code the indicators of the cultural heritage. The reasons are:
- For the clearly allochthonous sections of the population (Boers, Europeans, mixed-blood, Indians, Malays and others) adequate codes are missing. In a settler colony, the coding of the settlers had to be done under the specific colonial conditions. Such data rarely are available. Hence, the basic hypothesis postulating that the cultural heritage can explain differences in development, hardly can get tested.
- Large sections of the population were, and still are, working away from home: either within the country or as migrant workers outside. For example: Around 1960, the majority of the Swazi population were living and working in South Africa. The Swazi are constituted of more than 70 clans out of which ca. 20 % belong to the true Swazi, ca. 15 % belong to those found ahead and the rest to those who arrived after. Since nothing is known of socioeconomic differences between the three categories, they were not considered.
- The South African Bantus were divided into eight linguistic categories by the apartheid policy: Xhosa, Zulu, Wazi, Ndebele, North-Sotho, South-Sotho, Tswana and Venda. Such grouping on linguistic grounds was far from ideal, but under given conditions, i was the only possible solution. Hence, each language group got its own record in place of all groups speaking that language.
- Due to the Boer war (1899-1902), the Zulu state building process and the apartheid policy, many ethnic groups were torn apart, got newly formed or migrated to neighboring countries (Lesotho, Botswana, etc.). For example, the Zulu – originally composed of many independent tribes – got united under the leadership of Shakas. Some of the original tribes got newly constituted in the neighborhood of missionary stations, others got divided. The resulting ethnic puzzle lead to the forming of new groups which were out of reach for the ATLAS.
- The white (European) population in South Africa is represented by only two datasets: One for the Britisch and one for the Boers. The codes of the Coloureds got a data set which is a Boers-set with some modifications ➔ Cultural Fractionalization, ➔ most important Languages.
Finally, in spite of these problems, South Africa was included in the ATLAS and the data bank. Based on the statistical results it appears that the coding of South Africa is good enough to produce reasonable results. They perfectly fit in the general pattern of the 95 African and Asian countries.
Complete Documentation of all cultural units and codes by country (part of the dataset)